Session Information
Date: Monday, November 9, 2015
Title: Imaging of Rheumatic Diseases Poster II: X-ray, MRI, PET and CT
Session Type: ACR Poster Session B
Session Time: 9:00AM-11:00AM
Background/Purpose: To
evaluate the usefulness of computed tomography (CT)-measured aortic wall
thickness (AWT) as a sole imaging finding for the confirmation of clinically
suspected aortitis.
Methods: CT scans of 20
patients with the diagnosis of aortitis, endorsed by
the abnormally thickened aortic wall, as a single imaging finding, and 250
patients without known aortitis were reviewed and AWT
manually measured at the levels of thoracic descending aorta, upper abdominal
aorta and infrarenal aorta, as well as the level of
maximal AWT in patients with diagnosed aortitis.
Patients’ charts were analyzed and demographic data and data on co-morbidities
extracted. Correlations of measured AWT with patients’ demographic data and
co-morbidities were calculated for the control patients. Age-dependent upper
97.5 percentile points for AWT were calculated for different age groups as a
reference. AWT of patients, diagnosed with aortitis,
was compared with these reference values.
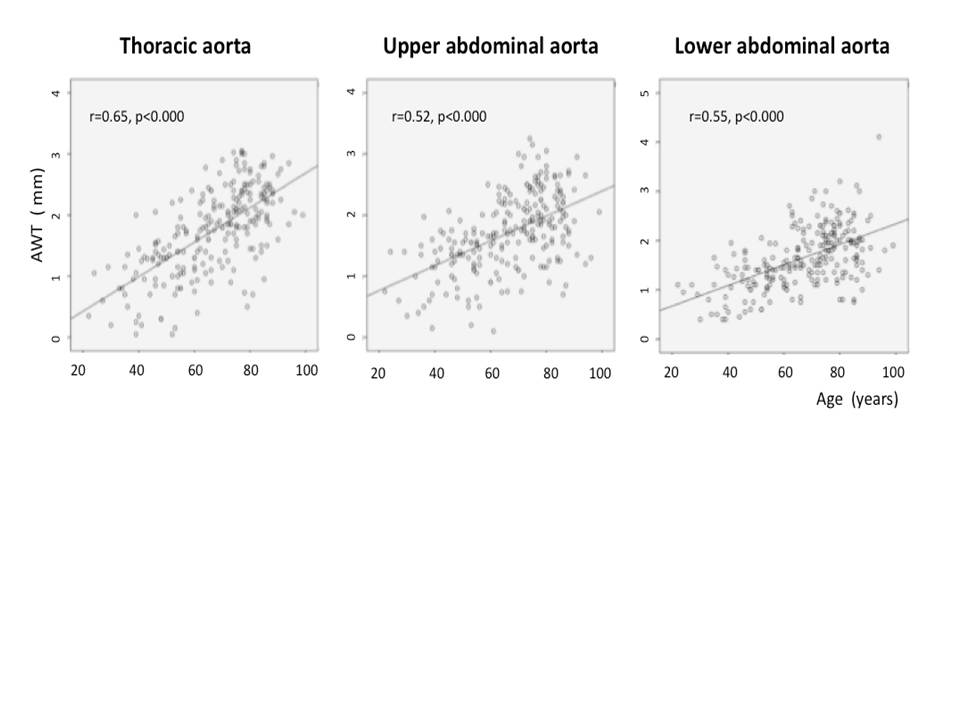
Results: AWT had significant positive correlation with patient age
(p<0.001), gender (p<0.03) and presence of aortic wall calcifications (p<0.001).
In 9 of 20 patients, with diagnosed aortitis confirmed by the increased CT-measured AWT, the
revised values of AWT were lower than calculated upper 97.5 percentile
point for the relevant age group. In 4 of these patients, the values of the
measured AWT were in the range of mean+SD for AWT for
the same age.
Conclusion: The
confirmation of suspected aortitis by the increased
CT-measured AWT only may be equivocal and necessitate more specific imaging,
particularly in elderly patients.
Fig 1. Correlation plots of AWT with patients’ age
Table 1. AWT in
different age groups
|
Age groups (years)
|
Thoracic Aorta Mean SD¤ 97.5¦
|
Upper Abdominal Aorta Mean SD¤ 97.5¦
|
Lower Abdominal Aorta Mean SD¤ 97.5¦
|
|
<50 |
0.998 0.49 1.96
|
1.188 0.46 2.08
|
1.063 0.42 1.89
|
|
50-70 |
1.544 0.57 2.66
|
1.535 0.53 2.57
|
1.504 0.47 2.43
|
|
>70 |
2.133 0.54 3.19
|
2.012 0.55 3.09
|
1.927 0.55 3.01
|
Mean value of aortic wall thickness (mm)
¤ Standard deviation
¦ Upper 97.5 percentile point
Table 2. Correlations of AWT with patients’ demographic data and
co-morbidities. Summary of the multivariate regression analysis (p values)
|
Thoracic Aorta |
Upper Abdominal Aorta |
Lower Abdominal Aorta |
|
|
Age |
<0.001 |
<0.001 |
<0.001 |
|
Gender |
0.03 |
0.029 |
<0.001 |
|
AW Calcifications |
<0.001 |
<0.001 |
<0.001 |
|
Arterial Hypertension |
0.179 |
0.830 |
0.329 |
|
Hyperlipidemia |
0.656 |
0.758 |
0.375 |
|
Diabetes Mellitus |
0.714 |
0.997 |
0.979 |
|
Coronary Artery Disease |
0.866 |
0.144 |
0.459 |
To cite this abstract in AMA style:
Slobodin G, Nakhleh A, Rimar D, Wolfson V, Rosner I, Odeh M. Increased Aortic Wall Thickness for the Diagnosis of Aortitis: a Computed Tomography-Based Study [abstract]. Arthritis Rheumatol. 2015; 67 (suppl 10). https://acrabstracts.org/abstract/increased-aortic-wall-thickness-for-the-diagnosis-of-aortitis-a-computed-tomography-based-study/. Accessed .« Back to 2015 ACR/ARHP Annual Meeting
ACR Meeting Abstracts - https://acrabstracts.org/abstract/increased-aortic-wall-thickness-for-the-diagnosis-of-aortitis-a-computed-tomography-based-study/

