Session Information
Date: Monday, November 18, 2024
Title: Abstracts: Systemic Sclerosis & Related Disorders – Clinical II
Session Type: Abstract Session
Session Time: 3:00PM-4:30PM
Background/Purpose: RNA gene expression allows to identify differentially expressed genes (DEG) in Systemic sclerosis (SSc) patients compared to healthy controls. Using unsupervised machine learning Milano et al. evaluated DEG from skin biopsies of SSc patients and described 4 molecular subsets. Subsequently, Franks et al. used supervised machine learning to develop a DEG based classifier that identifies the 3 most important molecular subsets of SSc: “fibroproliferative”, “normal like” and “inflammatory”. Finally, these molecular subsets were identified though a DEG signature in peripheral blood of SSc patients in the SCOT trial. It has been shown that the inflammatory and fibroproliferative subsets who undergone AHSCT had a survival benefit over cyclophosphamide while “normal like” did not. Identifying DEG using RNA gene expression is expensive and cumbersome. Deconvolution analysis of gene expression enables the estimation of relative cell frequencies in a blood sample.
Methods: Gene expression data were obtained from the Gene Expression Omnibus (GEO) database (accession number GSE134310). Deconvolution was performed using the CIBERSORTx algorithm implemented in R (IOBR package, version 0.99.9) with default parameters. We used Principal component analysis (PCA) and following a loading analysis.
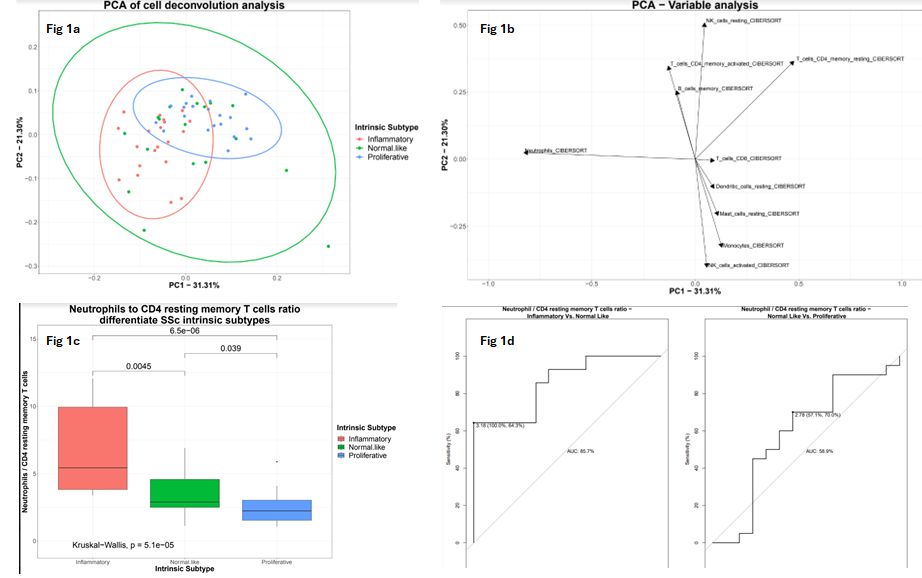
Results: PCA of the deconvolution-based cell frequencies estimates allowed visualization of the 3 molecular subsets (Figure 1a). Using loading analysis, we revealed that the leading sources of separation between the molecular subsets were neutrophils and CD4 resting memory T cells (RM-T cells) (Figure 1b). These cell populations drive the separation on PC1, which in turn explains 31.3% of the variance and distinguishes the inflammatory subset from the fibroproliferative subset. For each sample we calculated the ratio between these cell populations (neutrophils to RM-T). Our analysis demonstrated that these specific cells ratio successfully differentiates between SSc subsets (Kruskal-Wallis test, p = 5.1e-5), (Figure 1c). We conducted sensitivity and specificity analyses to identify the best threshold for separation from the normal like subset . A ratio above 3.18 was able to identify the inflammatory subset with a sensitivity of 64.3%, specificity of 100%, and an area under the curve (AUC) of 85.7%. A ratio lower than 2.78 identified the fibroproliferative subset with a sensitivity of 70%, a specificity of 57.1%, and an AUC of 58.9% (figure 1d)
Conclusion: Using deconvolution analysis, we were able to show that the neutrophils to RM-T cells ratio may identify the molecular subsets of SSc. These cell subsets may be identified using flow cytometry (RMT cells are defined as the activated memory T cells [CD3+ CD4+ HLADR+ ] deducted from the total memory T cells [CD3+ , CD4+ , CD45RA- ]), enabling us to use this method as a practical and readily available tool in everyday practice. Identifying the molecular subsets of SSc holds a promise as tool to predict outcomes, to enrich studies, to define molecular remission after AHSCT and to diagnose a relapse. Future research should evaluate the cellular signature approach against RNA gene expression based molecular subsets in validation cohorts.
Figure 1b – Loading analysis reveals that PC1 explains 31% of the variance in the data. The most discriminating cell populations on the x axis were neutrophils and CD4 resting memory t cells.
Figure 1c- The ratio between neutrophils and resting memory T cells was different between the 3 groups with statistical significance.
Figure 1d – A receiver operating characteristic curve (ROC) was used to examine sensitivity and specificity analyses for each subtype comparison. For the inflammatory vs. normal-like subtype comparison, the neutrophil to RM-T ratio threshold was selected to be 3.18, sensitivity was 64.3%, specificity was 100%, and the AUC was 85.7%. For the normal-like vs. fibroproliferative subtype comparison, the threshold was 2.78, sensitivity was 70%, specificity was 57.1%, and the AUC was 58.9%.
To cite this abstract in AMA style:
Feldman E, Milman N, S. Shen-Orr S, Rimar D. Identifying Systemic Sclerosis Molecular Subtypes by Their Cellular Signature – Deconvoluting the Puzzle [abstract]. Arthritis Rheumatol. 2024; 76 (suppl 9). https://acrabstracts.org/abstract/identifying-systemic-sclerosis-molecular-subtypes-by-their-cellular-signature-deconvoluting-the-puzzle/. Accessed .« Back to ACR Convergence 2024
ACR Meeting Abstracts - https://acrabstracts.org/abstract/identifying-systemic-sclerosis-molecular-subtypes-by-their-cellular-signature-deconvoluting-the-puzzle/

