Session Information
Session Type: ACR Poster Session A
Session Time: 9:00AM-11:00AM
Background/Purpose:
It is well established that RA patients have lower health related quality of life (HRQoL) across several domains compared with the general population, whereas less is known about PsA patients.
The aim of this study was to compare the Medical Outcomes Survey Short Form-36 (SF-36) Physical and Mental Component Summaries (PCS, MCS) as well as domain scores between RA and PsA patients from a large prospective observational registry.
Methods:
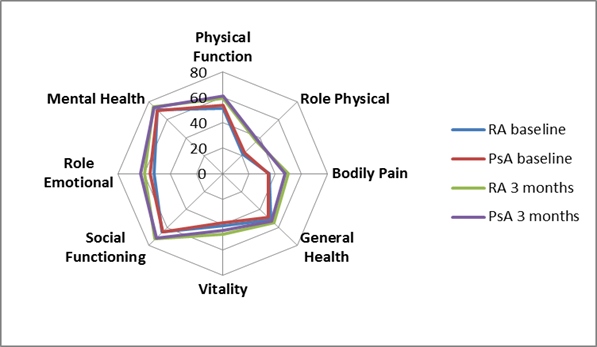
We included first-time enrolled RA and PsA patients from the prospective observational multicenter NORwegian-Disease Modifying Anti-Rheumatic Drug (NOR-DMARD) study, starting synthetic and biologic DMARDs between year 2000 and 2012. Continuous variables were compared using independent t-test or Mann-Whitney U-test, as appropriate. Prespecified ANCOVA analyses adjusted for age, gender and disease duration were performed to compare the SF-36 domains between RA and PsA patients at baseline and after 3 months follow-up. Spyder diagram was made to visualize the differences in health domains (0 worst, 100 best) between the RA and PsA patients.
Results:
A total of 3903 RA and 1518 PsA patients were included (mean (SD) age 56.8 (31.6)/ 47.9 (12.6) years, median (25th-75th percentile) disease duration 1.9 (0.07-11.0)/ 2.0 (0.12-9.6) years, 71.2%/ 50.2% women). Mean (SD) 28-joint Disease Activity Score was higher in RA vs. PsA patients at baseline (4.9 (1.4)/ 4.2 (1.3)) and at 3 months (3.8 (1.5)/ (3.3 (1.4)) follow-up (p≤0.001). Unadjusted means and adjusted estimated marginal means of PCS, MCS and domain scores all improved during follow-up (table, figure). In adjusted analyses PCS and MCS were similar between the RA and PsA patients. However, RA patients had slightly worse physical function and role emotional domains and PsA patients had slightly worse general health and vitality domains both at baseline and at 3 months. Bodily pain was similar between RA and PsA patients at baseline, but slightly worse in the PsA patients at 3 months follow-up.
Conclusion:
Levels of HRQoL were comparable across all SF-36 domains and component summary scores between patients with RA and PsA, in spite of higher levels of joint inflammation in the RA patients.
Table Unadjusted and adjusted analyses of SF-36 component summary and domain scores
|
|
Summary score/ domain |
Unadjusted analyses, mean (SD) |
p-value1 |
Estimated marginal means (95%CI) |
p-value2 |
||
|
RA |
PsA |
RA |
PsA |
||||
|
Baseline |
Physical Component Summary |
31.0 (9.9) |
31.8 (9.5) |
0.01 |
31.7 (31.3-32.0) |
31.6 (31.1-32.1) |
0.88 |
|
Mental Component Summary |
46.0 (11.4) |
46.3 (11.5) |
0.31 |
46.4 (46.0-46.8) |
46.3 (45.7-46.8) |
0.72 |
|
|
Physical Function |
49.7 (25.0) |
54.5 (23.4) |
<0.001 |
51.6 (50.8-52.4) |
53.9 (52.7-55.2) |
0.002 |
|
|
Role Physical |
20.0 (31.6) |
23.7 (34.1) |
<0.001 |
21.4 (20.3-22.5) |
23.4 (21.8-25.1) |
0.04 |
|
|
Bodily Pain |
34.5 (19.0) |
34.7 (18.2) |
0.77 |
35.4 (34.8-36.1) |
34.5 (33.6-35.5) |
0.13 |
|
|
General Health |
51.1 (20.3) |
49.4 (20.7) |
0.006 |
51.7 (51.1-52.4) |
49.2 (48.2-50.3) |
<0.001 |
|
|
Vitality |
39.2 (20.5) |
38.7 (20.9) |
0.39 |
41.1 (40.4-41.8) |
38.6 (37.6-39.7) |
<0.001 |
|
|
Social Functioning |
63.9 (26.4) |
64.8 (25.8) |
0.28 |
65.5 (64.6-66.4) |
64.7 (63.4-66.0) |
0.34 |
|
|
Role Emotional |
51.4 (42.9) |
55.8 (42.9) |
0.001 |
52.3 (50.9-53.8) |
55.3 (53.1-57.4) |
0.03 |
|
|
Mental Health |
70.0 (18.3) |
70.6 (17.7) |
0.31 |
71.0 (70.3-71.6) |
70.6 (69.7-71.5) |
0.52 |
|
|
3 Months |
Physical Component Summary |
35.6 (11.1) |
36.4 (10.8) |
0.06 |
36.4 (36.0-36.8) |
36.1 (35.5-36.7) |
0.54 |
|
Mental Component Summary |
48.1 (10.9) |
48.1 (11.3) |
0.98 |
48.2 (47.8-48.6) |
48.0 (47.3-48.6) |
0.55 |
|
|
Physical Function |
57.6 (25.9) |
62.1 (24.3) |
<0.001 |
59.6 (58.7-60.6) |
61.4 (60.0-62.8) |
0.04 |
|
|
Role Physical |
34.5 (38.9) |
38.3 (39.5) |
0.003 |
35.9 (34.4-37.4) |
37.5 (35.3-39.7) |
0.23 |
|
|
Bodily Pain |
49.0 (22.0) |
47.9 (21.3) |
0.12 |
49.8 (49.0-50.6) |
47.5 (46.3-48.8) |
0.002 |
|
|
General Health |
54.2 (21.2) |
53.1 (21.7) |
0.14 |
54.8 (54.0-55.6) |
52.9 (51.6-54.1) |
0.009 |
|
|
Vitality |
46.7 (21.5) |
45.0 (21.1) |
0.02 |
48.1 (47.3-48.9) |
44.8 (43.6-46.0) |
<0.001 |
|
|
Social Functioning |
71.8 (24.7) |
72.2 (24.8) |
0.68 |
73.0 (72.0-73.9) |
71.8 (70.4-73.2) |
0.19 |
|
|
Role Emotional |
59.7 (41.4) |
64.0 (40.9) |
0.002 |
60.0 (58.4-61.5) |
63.0 (60.7-65.4) |
0.03 |
|
|
Mental Health |
74.2 (17.3) |
74.1 (17.1) |
0.84 |
74.8 (74.2-75.5) |
73.9 (73.0-74.9) |
0.15 |
|
1 Independent t-test; 2ANCOVA adjusted for age, gender and disease duration
Figure Estimated marginal means adjusted for age, gender and disease duration of baseline and 3 months SF-36 domains
To cite this abstract in AMA style:
Michelsen B, Uhlig T, Kristianslund EK, Sexton J, Lie E, Fagerli KM, Hammer HB, Haugeberg G, Kvien TK. Health Related Quality of Life Is Comparable in Psoriatic Arthritis and Rheumatoid Arthritis Patients in Spite of Different Disease Activity. SF-36 Data from a Large Prospective Observational Multicentre Study [abstract]. Arthritis Rheumatol. 2017; 69 (suppl 10). https://acrabstracts.org/abstract/health-related-quality-of-life-is-comparable-in-psoriatic-arthritis-and-rheumatoid-arthritis-patients-in-spite-of-different-disease-activity-sf-36-data-from-a-large-prospective-observational-mul/. Accessed .« Back to 2017 ACR/ARHP Annual Meeting
ACR Meeting Abstracts - https://acrabstracts.org/abstract/health-related-quality-of-life-is-comparable-in-psoriatic-arthritis-and-rheumatoid-arthritis-patients-in-spite-of-different-disease-activity-sf-36-data-from-a-large-prospective-observational-mul/

