Session Information
Session Type: ACR Poster Session C
Session Time: 9:00AM-11:00AM
peptide antibodies (ACPA) is included in the 2010 ACR classification criteria
for RA. ACPA concentration, beyond ACPA positivity, is indicative of more
aggressive radiographic progression. However, there is limited information on
ACPA levels in clinical practice settings and its association with disease
activity measures.
comprises pts with established RA who were evaluated semi-annually for multiple
clinical PROs and resource utilization parameters. The current analysis is
based on pts enrolled in the registry with ACPA values at the time of baseline
visit. Baseline and follow-up ACPA levels were based on a well-documented and validated ELISA from Inova Diagnostics until its discontinuation in
2011; the Euro-Diagnostica assay (distributed by IBL-America, Minneapolis, MN), which supplied the ‘capture’
antibody for the original Inova Diagnostics ELISA, has been used since. In assessments,
the correlation between the two assays was 0.984. Mean changes from baseline over the first 5 years (yrs)
of enrolling into the registry were calculated. Four categories of ACPA change
from baseline were created based on quartiles of the distribution of ACPA change
to Yr 1. Multivariate regression analyses controlling for baseline covariates
were conducted to evaluate associations between ACPA change from baseline quartiles
and disease activity measures defined by CDAI, SDAI, DAS28 (CRP) and joint
counts.
Conclusion: We observed that ACPA titers change over
the current analysis. The mean (SD) age of the
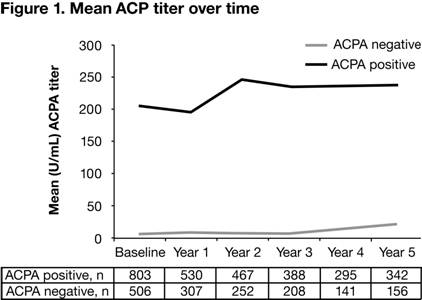
cohort was 56.01 (14.04) yrs and 83.2% were females. Figure 1 represents the mean
of ACPA levels up to Yr 5. The mean (SD) change in ACPA in
ACPA+ pts was –0.5 (71.3) U/ml, 50.8 (93.9) U/ml, 33.1 (123.1) U/ml, 33.9
(132.0) U/ml, 40.6 (122.4) for Yr 1 through Yr 5, respectively. The ACPA mean
change to Yr 1 quartiles had the following cut-off values: Q1 >–488.1 to ≤–13.6
U/ml; Q2 >–13.6 to ≤0.0 U/ml; Q3 >0 to ≤8.8 U/ml; Q4 >8.8
U/ml. The mean reductions in disease activity based on CDAI, SDAI and joint
counts were greatest for Q1 (Figure 2). Similar patterns of change in disease
activity were observed after controlling for baseline covariates in
multivariate analysis.
time and ACPA increase is primarily observed in ACPA+ pts with higher ACPA
values at baseline. Pts with reduction in ACPA show a numerically greater
reduction in disease activity levels.
To cite this abstract in AMA style:
Alemao E, Gandhi K, Iannaccone C, Frits M, Coblyn J, Shadick N, Weinblatt M. Evaluation of Anti-Cyclic Citrullinated Peptide Autoantibody Levels in Clinical Practice and Its Association with Disease Activity [abstract]. Arthritis Rheumatol. 2015; 67 (suppl 10). https://acrabstracts.org/abstract/evaluation-of-anti-cyclic-citrullinated-peptide-autoantibody-levels-in-clinical-practice-and-its-association-with-disease-activity/. Accessed .« Back to 2015 ACR/ARHP Annual Meeting
ACR Meeting Abstracts - https://acrabstracts.org/abstract/evaluation-of-anti-cyclic-citrullinated-peptide-autoantibody-levels-in-clinical-practice-and-its-association-with-disease-activity/


