Session Information
Date: Sunday, November 12, 2023
Title: Patient Perspectives Poster
Session Type: Poster Session A
Session Time: 9:00AM-11:00AM
Background/Purpose: As a researcher and data analyst, I enjoy the meticulous attention to detail that my work requires. I love the process of collecting, analyzing, and interpreting data to find patterns to ultimately improve population health. My passion for public health comes from my own health battles: I have rheumatoid arthritis and several other chronic conditions. These require ongoing maintenance, including doctor appointments, medications, labs, prior authorizations, referrals, and more. I started seeing more specialists in my 20s, and with each new specialist it became increasingly challenging to remember all of the complex and intricate details of my health management plan. I felt overwhelmed trying to stay on top of all of the moving parts, and I realized I needed to make a change.
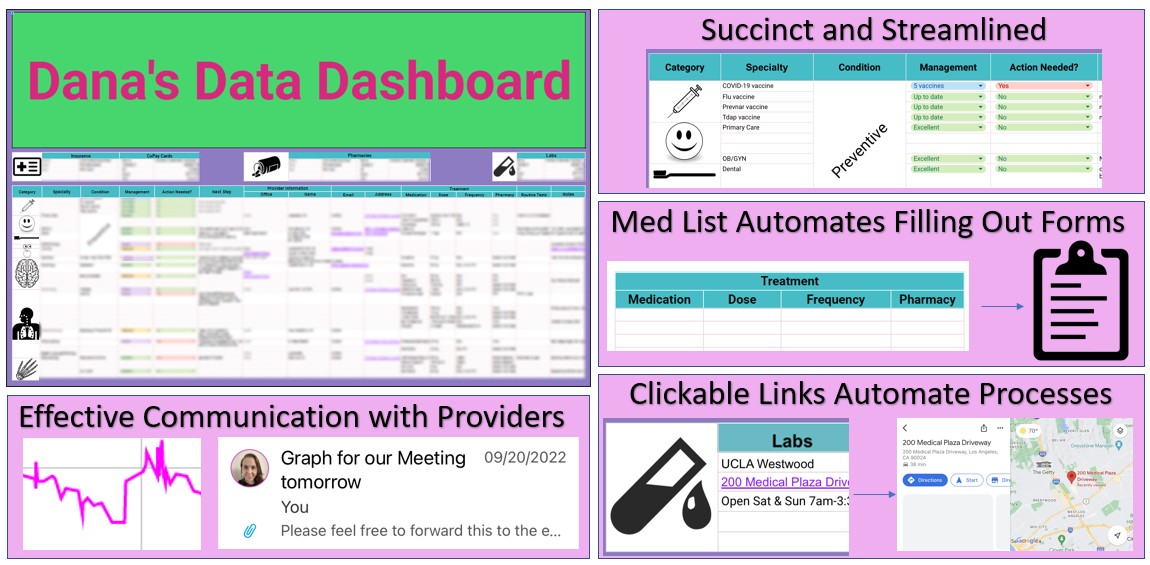
Intervention: I applied a familiar framework to my health management by turning it into a research project! The first step was getting organized, so I created a spreadsheet to manage my health information. Although it accomplished my immediate goal of getting organized, the spreadsheet was very plain and I did not use it often. I decided to turn it into a Dashboard (Figure 1). In the research world, a “Dashboard” is any data visualization platform that distills large amounts of complex information into a user-friendly data snapshot. I’m a fun and vibrant person, and the design needed to match this. I added colors, icons, clickable dropdown buttons, and optimized it for use on a computer or mobile device. I embedded links to different apps – for example, clicking an address pulls up real-time directions.
Maintenance: My dashboard greatly improved my health management in several ways: (1) My approach changed from reactive to proactive (Figure 2). I now stay on top of appointments, medication refills, labs, prior authorizations, etc. long before they are due. (2) My communication with my health care team substantially improved. I can communicate large amounts of accurate health data efficiently, concisely, and effectively. I can articulate my thoughts much more clearly. For example, if I want to demonstrate a pattern I’ve noticed, I present it in a graph. (3) I am significantly more confident about my health management. Visualizing my progress allows me to come up with creative ideas and solutions to problems efficiently – just like a research project! (4) Most importantly, these changes have led to reduced stress levels and a decrease in symptoms of my arthritis and other chronic conditions.
Quality of Life: Dana’s Data Dashboard transformed my health management. Not only can I manage my health anytime and anywhere (Figure 3), but it has enabled me to “zoom out on the graph.” Instead of focusing on the day-to-day never-ending list of tasks, I can see the bigger picture: I am finally managing my health effectively. The final piece of any research project is disseminating findings in a way that can help others – hence this abstract! My hope is that this abstract will provide inspiration for others to work with their medical team to utilize their own strengths and interests to translate their health management into an area of their life in which they can excel and thrive.
To cite this abstract in AMA style:
Guglielmo D. Dana’s Data Dashboard: Applying a Familiar Framework for Efficient and Effective Health Management [abstract]. Arthritis Rheumatol. 2023; 75 (suppl 9). https://acrabstracts.org/abstract/danas-data-dashboard-applying-a-familiar-framework-for-efficient-and-effective-health-management/. Accessed .« Back to ACR Convergence 2023
ACR Meeting Abstracts - https://acrabstracts.org/abstract/danas-data-dashboard-applying-a-familiar-framework-for-efficient-and-effective-health-management/


