Session Information
Session Type: Poster Session A
Session Time: 10:30AM-12:30PM
Background/Purpose: Polygenic risk scores quantify the composite impact of numerous genetic variants to predict disease risk. However, conventional polygenic risk scores have limitations in revealing the biological roles of the risk variants due to its construction. Here, we applied a novel approach, the cell type-specific polygenic risk score (csPRS) and assessed whether csPRS could effectively stratify individuals into distinct groups.
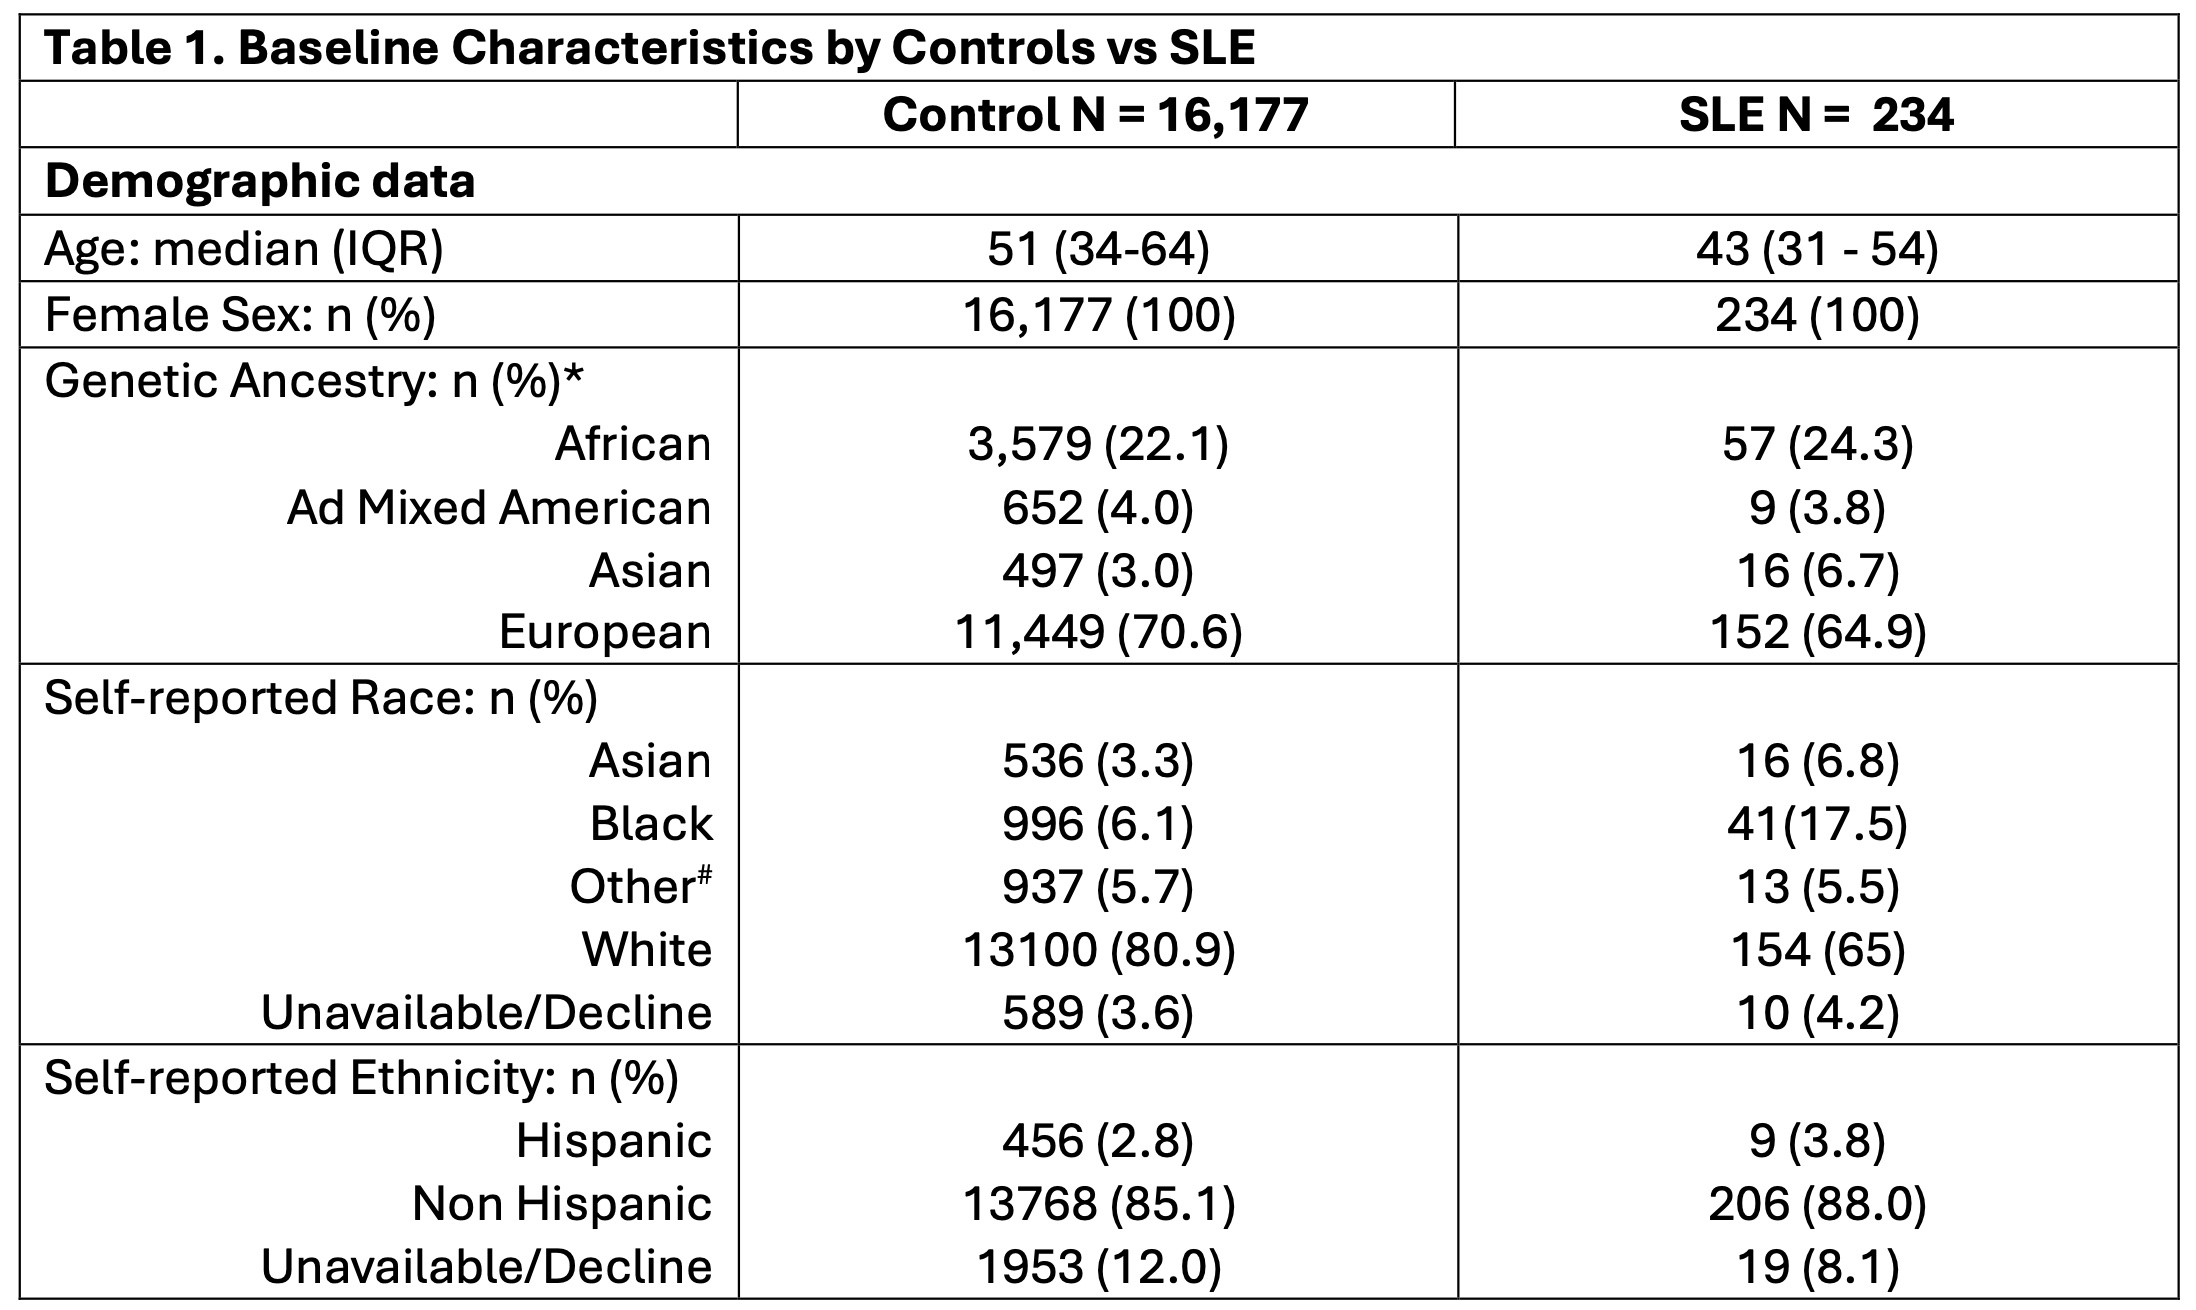
Methods: Genotyping data from the Illumina Global Screening Array were collected from 234 female SLE patients and 16,177 ancestry-matched controls without autoimmune conditions from the Mass General Brigham Biobank. Patients and controls were categorized into four genetic ancestries based on their genotypes using principal component analysis and reference populations from the 1000 Genomes Project (Table 1). A list of risk SNPs was obtained from a published multi-ancestry GWAS meta-analysis. Public open chromatin data (ATAC-seq) from human peripheral blood immune cell types—B cells, T cells, monocytes, and NK cells—was utilized to select cell-type specific open chromatin regions and cell type-specific peaks were then used to classify SLE risk loci. csPRS were generated for both SLE patients and controls using a high-performance PRS model (Pruning + Thresholding [p-value: 5×10⁻⁴], AUC > 0.7). Each csPRS was normalized to have a mean of 0 and a standard deviation of 1. Student’s t-tests were employed to assess differences in csPRS between SLE patients and controls. Patients were then clustered into subgroups based on their csPRS using a heatmap.
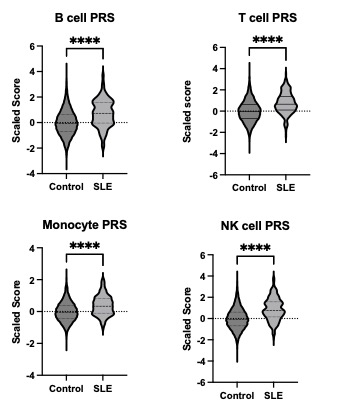
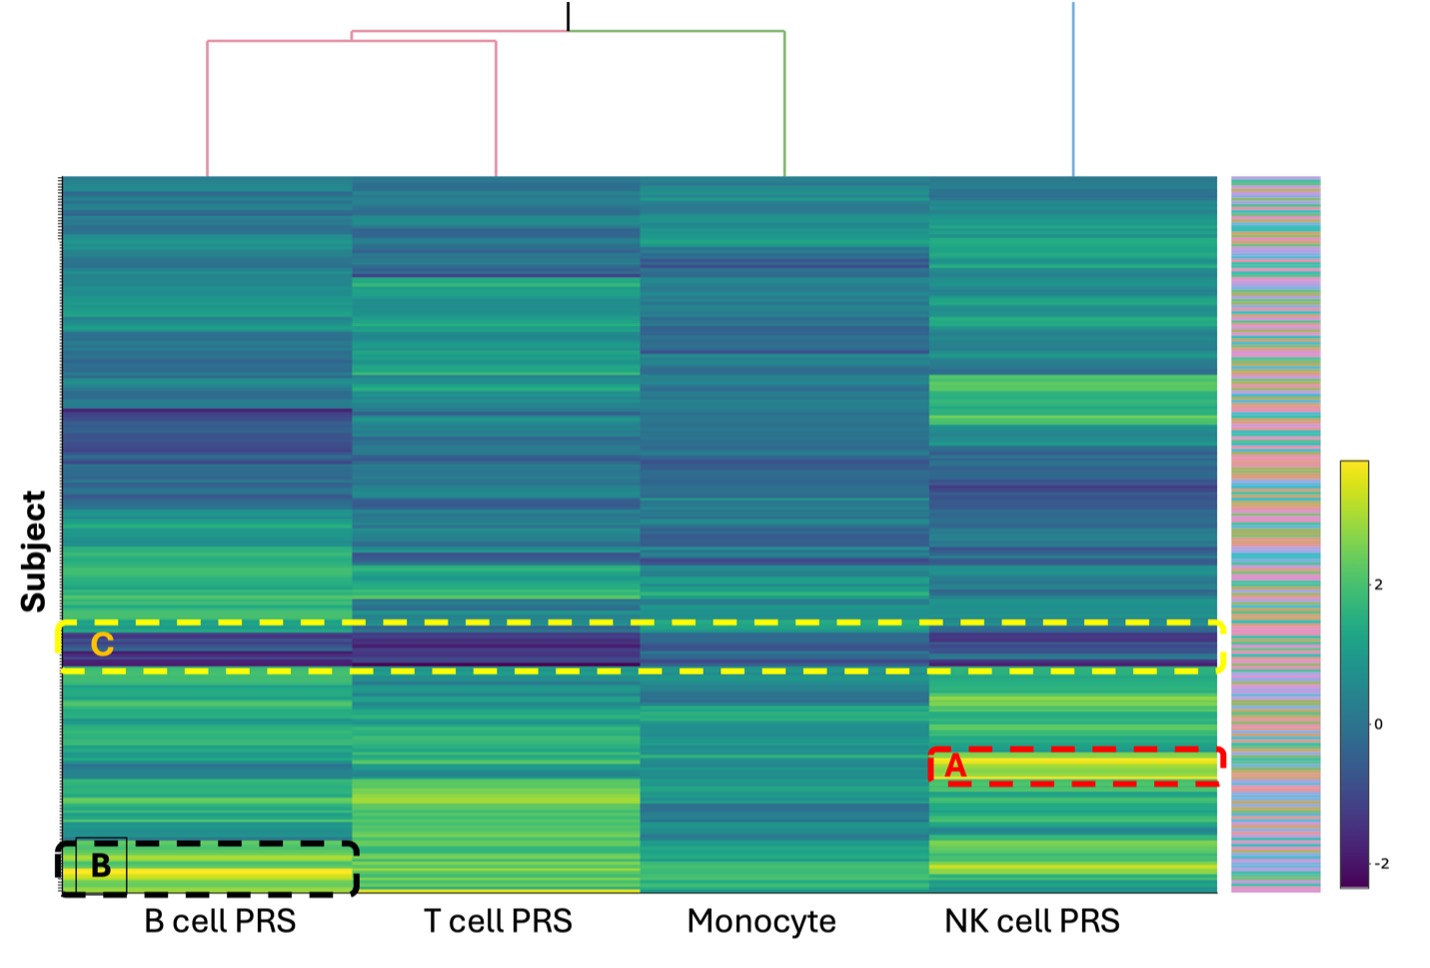
Results: Analysis conducted using Student’s t-test revealed that all csPRS in the SLE group were elevated compared to the control group. The NK cell PRS exhibited the largest mean difference between the SLE and control groups (0.8821 ± 0.06548, p < 0.0001), while the monocyte PRS showed the smallest difference (0.3833 ± 0.04000, p < 0.0001) between the two groups (Figure 1). A heatmap of the csPRS in the SLE cohort shows variability in csPRS among patients (Figure 2). We observed three distinctive groups: a high NK cell PRS group (Group A, n=12), a high B cell PRS group (Group B, n=16), and an all-PRS-low group (Group C, n=11) in the hierarchical cluster. Each cluster revealed heterogeneity among SLE patients. The high B cell PRS group (Figure 2, Group B) had the lowest mean age of disease onset (38.8, SD [12.4]). Conversely, the group with low PRS across all cell types (Figure 2, Group C, n=11) exhibited a higher mean age of disease onset (42.4, SD [13.4]) compared to other groups.
Conclusion: Our study revealed that SLE patients exhibit a greater genetic risk burden associated with each immune cell type compared to controls. Furthermore, there exists significant heterogeneity among SLE patients concerning cell-type specific genetic risks. Further investigations into the correlation between cell type-related genetic risks and the biological and clinical phenotypes in SLE may yield additional insights into immunopathological subgroups of patients. Such insights are crucial for developing targeted therapeutic approaches.
* Four genetic ancestries were identified utilizing principal component analysis on genotype data from the 1000 Genomes Project.
# Other includes American Indian, Alaska native, Hawaiian, other pacific islanders, and others.
To cite this abstract in AMA style:
Kim L, Aguiar V, Fernandez-Salinas D, Sparks J, Nigrovic P, Chang J, Gutierrez-Arcelus M. Comparison of Cell Type-Specific Polygenic Risk in Systemic Lupus Erythematosus Patient and Healthy Controls [abstract]. Arthritis Rheumatol. 2024; 76 (suppl 9). https://acrabstracts.org/abstract/comparison-of-cell-type-specific-polygenic-risk-in-systemic-lupus-erythematosus-patient-and-healthy-controls/. Accessed .« Back to ACR Convergence 2024
ACR Meeting Abstracts - https://acrabstracts.org/abstract/comparison-of-cell-type-specific-polygenic-risk-in-systemic-lupus-erythematosus-patient-and-healthy-controls/


