Session Information
Date: Monday, November 9, 2015
Title: Imaging of Rheumatic Diseases Poster II: X-ray, MRI, PET and CT
Session Type: ACR Poster Session B
Session Time: 9:00AM-11:00AM
Background/Purpose: There is evidence that the presence of synovitis in knee
osteoarthritis (OA) is clinically relevant since it is associated with pain and
structural damage. As several methods are available on MRI to assess and
quantify synovitis in knee OA, our aim was to compare different
semiquantitative and quantitative methods using both non-enhanced and gadolinium-enhanced
MRI.
Methods: End-stage clinical OA knees in patients undergoing a total knee
replacement surgery were included in this cross-sectional study. MRI was
performed and included non-enhanced (triplanar fat
suppressed (FS) intermediate-weighted sequences with fat suppression) as well
as gadolinium-enhanced sequences (sagittal and axial T1-weighted FS sequences).
Using non-enhanced MRI, we semiquantitatively assessed two features widely used
as surrogate for synovitis: “effusion-synovitis” (ES), representing a
combination of joint effusion and synovial thickening; and “Hoffa-synovitis”
(HS), representing ill-defined high-signal intensity of Hoffa’s fat pad at the
intercondylar region, both graded from 0 to 3. Using gadolinium-enhanced
sequences, we semiquantitatively assessed synovial thickness (ST) in 11 regions
of the knee, graded from 0 to 2. Then, we summed the scores for the 11 regions
and graded whole-knee synovitis as: grade 0 (total score<5), grade 1 (5-8),
grade 2 (9-12), and grade 3 (>12). Using manual segmentation we
quantitatively evaluated the total synovial volume (SV) on gadolinium-enhanced
sequences, in mm³, and defined 3 grades of SV as: grade 1 (<30mm³), grade 2
(30-60 mm²), and grade 3 (>60 mm³). As synovitis is ideally evaluated using
gadolinium-enhanced sequences, we assessed the correlations of synovitis grades
of ES and HS with synovitis grades of ST and SV, applying Spearman correlation
analysis. Furthermore, we compared the sum of scores of ST with SV as
continuous variables using Pearson correlation analysis.
Results: A total of 104 subjects (1 knee per subject) were included;
mean age 67 ± 7; 64 females (61.4%); mean body mass index 30 ± 5. The number of
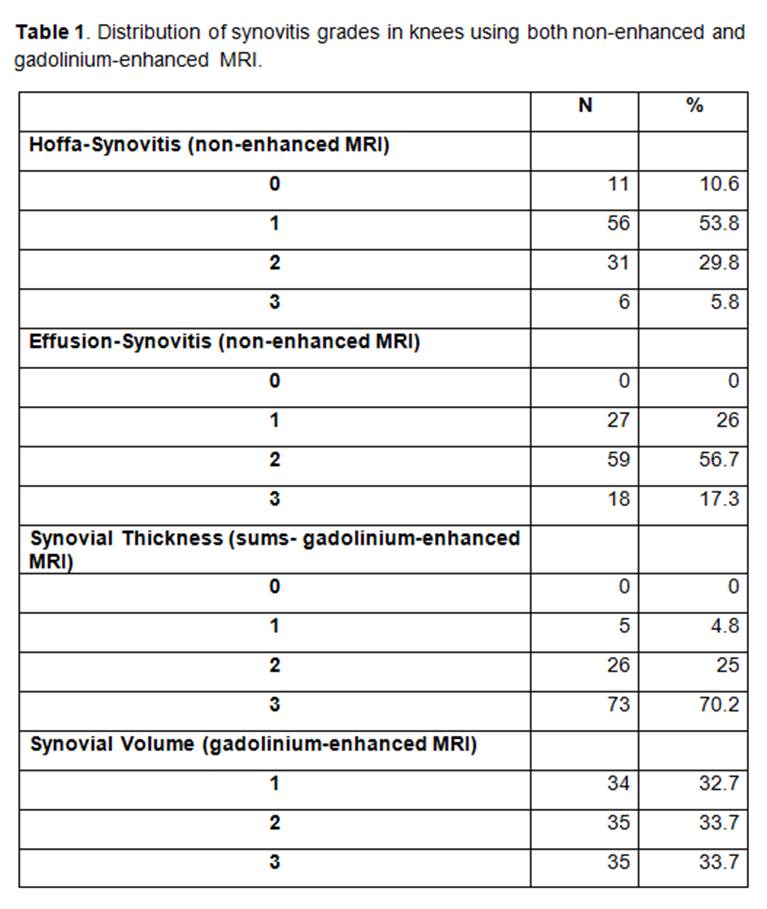
knees exhibiting the different grades of ES, HS, ST, and SV is presented in
Table 1. Using gadolinium-enhanced sequences, the mean summed score for “ST”
synovitis was 15.0 ± 3.8; the mean “SV” synovitis was 56.0 ± 17.1 mm³. A
positive and significant correlation was found between ES and ST (r=0.41;
p<.0001), as well as between HS and ST (r=0.32; p<.001). A positive and
significant correlation between the summed scores of ST and total SV was found
using gadolinium-enhanced sequences (r=0.53; p<.0001).
Conclusion: ES showed a better correlation with ST assessed on
gadolinium-enhanced sequences, and should be preferred over HS as a surrogate
marker for synovitis in knee OA studies in which gadolinium-enhanced sequences
are not available. Using gadolinium-enhanced sequences, both ST and SV methods
may be applied to assess knee synovitis.
To cite this abstract in AMA style:
Crema MD, Roemer F, Li L, Rosen LB, Dudley A, Alexander R, Guermazi A. Comparison Between Semiquantitative and Quantitative Methods for the Assessment of Knee Synovitis Using Non-Enhanced and Gadolinium-Enhanced MRI [abstract]. Arthritis Rheumatol. 2015; 67 (suppl 10). https://acrabstracts.org/abstract/comparison-between-semiquantitative-and-quantitative-methods-for-the-assessment-of-knee-synovitis-using-non-enhanced-and-gadolinium-enhanced-mri/. Accessed .« Back to 2015 ACR/ARHP Annual Meeting
ACR Meeting Abstracts - https://acrabstracts.org/abstract/comparison-between-semiquantitative-and-quantitative-methods-for-the-assessment-of-knee-synovitis-using-non-enhanced-and-gadolinium-enhanced-mri/

