Session Information
Session Type: Poster Session C
Session Time: 10:30AM-12:30PM
Background/Purpose: Compared to Apolipoprotein L1 (APOL1) low risk genotype (LRG) patients, APOL1 (HRG) has been shown to increase the risk of chronic kidney disease in lupus nephritis (LN) patients of recent African ancestry. In a two-hit hypothesis, both SLE-mediated inflammation and a genetic propensity toward kidney injury drive progressive kidney injury, however no biomarkers have been shown to capture HRG-associated risk. We therefore conducted this study to test the predictive value of routine LN biomarkers in APOL1 LRG and HRG LN patients.
Methods: This cross-sectional cohort study enrolled 59 SLE participants to address biomarkers of LN across APOL1 genotype. Participants were recruited and consented from a single, high volume SLE clinical center. Inclusion criteria were Adult (18y), self-reported Black race, At least 4 American College of Rheumatology criteria for SLE. PCR/sequencing was used to stratify participants by APOL1 genotype as follows: Low-Risk Genotype (LRG): G0/G0, G0/G1, or G0/G2 and High-Risk Genotype (HRG): G1/G1, G1/G2, or G2/G2. Monocytes were isolated from whole blood using Ficoll gradient centrifugation and subsequent magnetic cell separation, then sent for RNA sequencing. Medical charts at the time of blood sample collection were reviewed for SLE biomarkers (dsDNA, C3, C4, uPCR, eGFR) and to outfit SLEDAI scores. IFN signature was defined by the PC1 of a principal component analysis of IFN stimulated gene expression (IFI44, IFI44L, IFIT1, IFIT3, MXA, IRF5, SIGLIC1, MX1, IFI6, USP18, IRF7, ISG15). Generalized linear models (GLM) with binomial distribution were utilized to construct logistic regression models describing the relationship between nephritis and SLE biomarkers in LRG vs HRG participants.
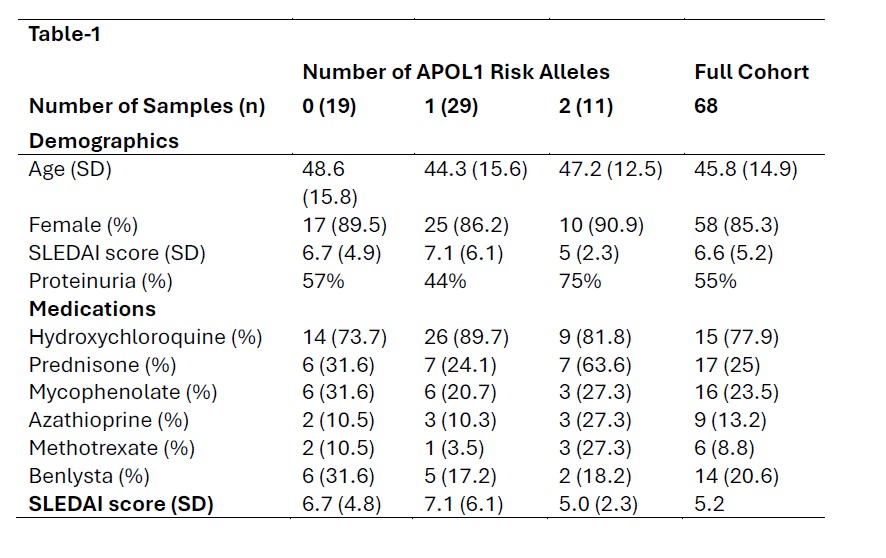
Results: Participant demographics and clinical features are shown in Table 1. We enrolled 48 LRG and 11 HRG participants. A higher proportion of the LRG group had high dsDNA antibody titers and low complement levels than the HRG participants. Paradoxically, mean urine protein/creatinine ratio was of 0.13 in the LRG and 2.0 in the HRG group respectively and eGFR was 102.1 in the LRG and 64.0 in the HRG groups respectively (p=0.002). In a model assessing the relationship between nephritis and SLE biomarkers, dsDNA positivity (OR = 44.6, p = 0.0457) and the interaction between positive dsDNA status and decreased serum C4 levels (OR = 1.24, p = 0.0147) were associated with lupus nephritis (LN); with a trend toward serum C4 levels associating with LN (OR = 0.88 for each single point increase in levels, p = 0.0702). When this model was applied to only HRG participants, there was no significant association with LN biomarkers (p= for dsDNA, C4, and the interaction term were 0.998, 0.568, and 0.998, respectively). In a linear regression model, there was a significant positive relationship between IFN signature and uPCR in the LRG group (B=0.08; p = 0.04) but not in the HRG group (B=0.3; p = 0.9).
Conclusion: Taken together these data suggest that LN biomarkers, dsDNA, C3, C4, and IFN signature may primarily be driving proteinuria in APOL1 LRG patients, but not APOL1 HRG patients. Therefore, these biomarkers maybe less effective in predicting risk in APOL1 HRG patients whose kidney injury may be driven by novel mechanisms.
To cite this abstract in AMA style:
Alizadeh M, Pandian V, Felix C, Nimoni A, Divers J, Niewold T, Blazer A. Biomarkers of Lupus Nephritis Are Less Predictive in APOL1 High Risk Genotype Lupus [abstract]. Arthritis Rheumatol. 2024; 76 (suppl 9). https://acrabstracts.org/abstract/biomarkers-of-lupus-nephritis-are-less-predictive-in-apol1-high-risk-genotype-lupus/. Accessed .« Back to ACR Convergence 2024
ACR Meeting Abstracts - https://acrabstracts.org/abstract/biomarkers-of-lupus-nephritis-are-less-predictive-in-apol1-high-risk-genotype-lupus/

