Session Information
Session Type: Poster Session A
Session Time: 10:30AM-12:30PM
Background/Purpose: The Non-High-Density Lipoprotein Cholesterol to High-Density Lipoprotein Cholesterol Ratio (NHHR) has emerged as a promising marker for atherosclerosis, yet its relationship with all-cause mortality in individuals with rheumatoid arthritis (RA) remains poorly understood. This study aims to explore the association between NHHR and mortality in adults with RA.
Methods: Data from the National Health and Nutrition Examination Survey (NHANES) spanning 2007 to 2016 were analyzed, with participants stratified into quartiles based on their NHHR levels. Key covariates included age, gender, body mass index (BMI), C-reactive protein (CRP), and the presence of comorbidities. Subgroup analyses were conducted to assess how the association between NHHR and mortality risk varied across different age groups, sexes, and comorbidity profiles, with interaction effects tested using likelihood ratio tests. Multivariable Cox proportional hazards models were applied to estimate the relationship between NHHR and all-cause mortality risk. Kaplan-Meier survival curves were generated to visualize survival differences among NHHR quartiles, and restricted cubic spline models were employed to explore potential non-linear associations. Sensitivity analyses were also performed to evaluate the robustness of the findings by excluding extreme NHHR values.
Results: Significant variations in baseline characteristics were observed across NHHR quartiles, including differences in age, BMI, cholesterol levels, and comorbidities. Higher NHHR values were associated with increased BMI, total cholesterol, and CRP levels, while individuals in the lowest NHHR quartile showed a higher prevalence of hypertension, diabetes, and coronary heart disease (CHD). NHHR was inversely associated with CHD and showed a positive association with diabetes, though the latter lost significance after adjusting for covariates. A U-shaped relationship was identified between NHHR and all-cause mortality in RA patients, with a risk threshold around 0.575. Kaplan-Meier analysis indicated improved survival with increasing NHHR levels (Log-rank P=0.00013), particularly among older adults (HR = 0.18) and cancer survivors (HR = 0.18). The initial associations were attenuated after covariate adjustment, and sensitivity analyses confirmed the robustness of the findings (bias = −0.024).
Conclusion: NHHR has emerged as a valuable prognostic marker in RA, demonstrating a U-shaped relationship with all-cause mortality, with a critical threshold of 0.575. Its predictive capacity supports the early identification of high-risk individuals, enabling personalized interventions to enhance patient survival and optimize RA management strategies.
.jpg) Figure 2 presents the survival analysis of RA patients. Panel A shows the survival area plot, illustrating the survival probabilities of RA patients over time. Panel B displays the survival contour plot, showing the survival probability at specific time points for RA patients. Panel C presents the survival curves by NHHR quartiles (Q1-Q4), highlighting the impact of different groups on survival probability. In Panel A, the color gradient (from red to blue) reflects changes in RA values over time. Higher RA values (red) are associated with higher survival probabilities, while lower RA values (blue) correspond to lower survival probabilities. In Panel B, S(t) represents the survival probability at various time points, ranging from 0 to 1. The color bar indicates different intervals of the survival function, with colors transitioning from purple to yellow, representing survival probabilities from low to high. Panel C features survival curves at the top: Q1 in red, Q2 in blue, Q3 in green, and Q4 in purple. The middle section shows the risk table, displaying the number of individuals at risk for each group (Q1, Q2, Q3, Q4) at each time point, with the remaining proportion for each group in parentheses. The bottom section represents censored events, with a histogram displaying the censoring status at different time points, color-coded by quartile group. Differences between survival curves across groups were tested using the Log-rank test.RA,Rheumatoid arthritis.
Figure 2 presents the survival analysis of RA patients. Panel A shows the survival area plot, illustrating the survival probabilities of RA patients over time. Panel B displays the survival contour plot, showing the survival probability at specific time points for RA patients. Panel C presents the survival curves by NHHR quartiles (Q1-Q4), highlighting the impact of different groups on survival probability. In Panel A, the color gradient (from red to blue) reflects changes in RA values over time. Higher RA values (red) are associated with higher survival probabilities, while lower RA values (blue) correspond to lower survival probabilities. In Panel B, S(t) represents the survival probability at various time points, ranging from 0 to 1. The color bar indicates different intervals of the survival function, with colors transitioning from purple to yellow, representing survival probabilities from low to high. Panel C features survival curves at the top: Q1 in red, Q2 in blue, Q3 in green, and Q4 in purple. The middle section shows the risk table, displaying the number of individuals at risk for each group (Q1, Q2, Q3, Q4) at each time point, with the remaining proportion for each group in parentheses. The bottom section represents censored events, with a histogram displaying the censoring status at different time points, color-coded by quartile group. Differences between survival curves across groups were tested using the Log-rank test.RA,Rheumatoid arthritis.
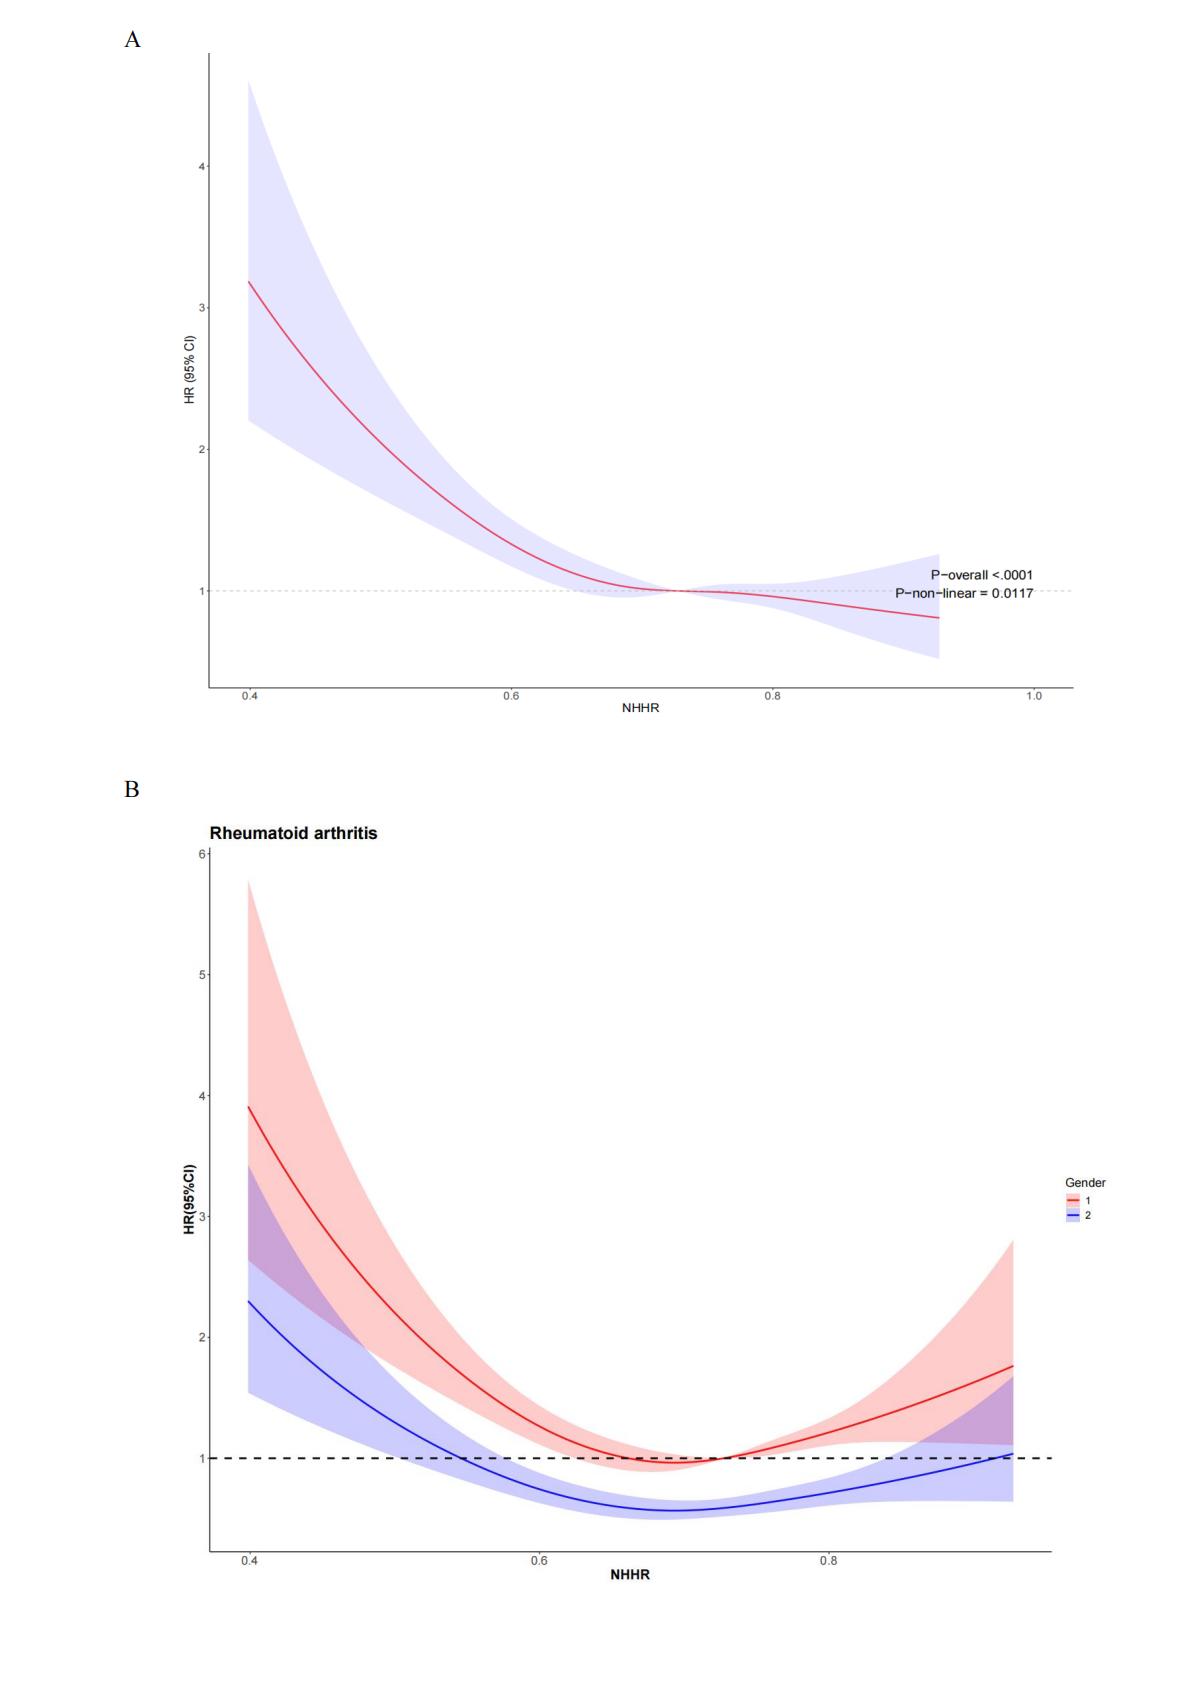
.jpg) Figure 4 illustrates the relationship between NHHR and all-cause mortality in patients with rheumatoid arthritis using restricted cubic splines (A), with stratified analyses by gender (B), race (C), and education level (D). The analysis was adjusted for age, gender, race/ethnicity, marital status, education level, household poverty-to-income ratio, BMI, CRP, smoking, alcohol consumption, hypertension, diabetes, stroke, coronary heart disease, and cancer history. Solid and dashed lines represent the estimated values and their corresponding 95% confidence intervals, respectively. BMI: Body Mass Index; CRP:C-reactive protein,HR: Hazard Ratio.
Figure 4 illustrates the relationship between NHHR and all-cause mortality in patients with rheumatoid arthritis using restricted cubic splines (A), with stratified analyses by gender (B), race (C), and education level (D). The analysis was adjusted for age, gender, race/ethnicity, marital status, education level, household poverty-to-income ratio, BMI, CRP, smoking, alcohol consumption, hypertension, diabetes, stroke, coronary heart disease, and cancer history. Solid and dashed lines represent the estimated values and their corresponding 95% confidence intervals, respectively. BMI: Body Mass Index; CRP:C-reactive protein,HR: Hazard Ratio.
Gender group: 1 represents Male, 2 represents Female.
Race group: 1 represents Mexican American, 2 represents Non-Hispanic Black, 3 represents Non-Hispanic White, 4 represents Other Hispanic, 5 represents Other Race.
Education level group: 1 represents Less than 9th grade, 2 represents 9-11th grade, 3 represents High School, 4 represents Some college or AA degree, 5 represents College graduate or above.
To cite this abstract in AMA style:
Wang T, Xiong S, Wei Y, Wang D, Zhang W, Liu C, zeng F, Wu J. Association Between the Ratio of Non-High-Density Lipoprotein Cholesterol to High-Density Lipoprotein Cholesterol and All-Cause Mortality Risk in Patients with Rheumatoid Arthritis: A Survival Analysis Based on NHANES Data [abstract]. Arthritis Rheumatol. 2025; 77 (suppl 9). https://acrabstracts.org/abstract/association-between-the-ratio-of-non-high-density-lipoprotein-cholesterol-to-high-density-lipoprotein-cholesterol-and-all-cause-mortality-risk-in-patients-with-rheumatoid-arthritis-a-survival-analysi/. Accessed .« Back to ACR Convergence 2025
ACR Meeting Abstracts - https://acrabstracts.org/abstract/association-between-the-ratio-of-non-high-density-lipoprotein-cholesterol-to-high-density-lipoprotein-cholesterol-and-all-cause-mortality-risk-in-patients-with-rheumatoid-arthritis-a-survival-analysi/