Session Information
Date: Sunday, October 26, 2025
Session Type: Poster Session A
Session Time: 10:30AM-12:30PM
Background/Purpose: Psoriatic arthritis (PsA) is associated with increased cardiovascular risk and a pro-atherogenic lipid profile. We hypothesize that alterations in lipid metabolism combined with systemic inflammation are present in the early disease stages of the disease and reflect pathophysiologic, metabolic changes characteristic for PsA. We investigated serum lipid profile in early PsA and examined whether changes in the profile or apolipoproteins are specific to early disease.
Methods: Adult patients with newly diagnosed treatment naïve PsA were included in the multicenter cohort study (Nf75). Clinical, demographic characteristics and comorbidities were collected. The serum lipids were measured: total cholesterol (TC), non-HDL-cholesterol (non-HDL-c), LDL-cholesterol (LDL-c), HDL-cholesterol (HDL-c), triglycerides (TAG), apolipoprotein B (ApoB) and apolipoprotein A1 (ApoA1). The results were compared to sex- and age matched healthy controls (HC) (Nf61) and rheumatoid arthritis (RA) patients (Nf50)(Kruskall-Wallis). The lipid measurements were re-evaluated in PsA patients after 1 year follow-up.
Results: The three groups were matched by age; HC and PsA patients were matched by age and sex. PsA patients had mainly oligoarticular disease, low PASI scores and a short symptom duration (median: 0.6 years). The mean DAPSA score (SD) was 19.5(10.8), corresponding to moderate disease activity. Early RA patients (disease duration (median: 0.5 years) all had polyarticular disease and moderate disease activity, mean(SD) DAS-28-CRP of 4.61(2.0).Among lipid measurements, HDL-c levels were lower in PsA than in HC and RA (df2, c210, p=0.006, PsA vs HC p=0.013) (Fig 1A-E), the levels of TC, LDL-C, TAG were not different in the three groups. Significant differences in ApoA1 and ApoB levels were observed between PsA, RA and controls. ApoB was higher in PsA than in RA patients but lower than in controls (df2, c243.8; p< 0.001). ApoA1 was markedly lower in PsA patients compared to both RA and controls (df2, c2118.9; p< 0.001)(Fig 1 F-H). In regression models, the levels of ApoA1, adjusted for age, sex, BMI, statin use, smoking status, CRP levels and interaction between them, were predictive of PsA diagnosis with 90.6% accuracy. In ROC analysis, ApoA1 was predictive of the diagnosis of PsA with a specificity of 82.4% and a sensitivity of 83.8% at an optimal cut-off value of 1403 µg/ml (AUC[95%CI] 0.886[0.83-0.941]) (Fig 2). At 1 year follow-up only ApoA1 levels, but not other lipid measurements, increased in PsA patients achieving DAPSA LDA, while ApoB levels remained comparable to baseline (Fig 3).
Conclusion: Decreased levels of ApoA1 and increased levels of ApoB are specific to early and treatment naïve patients with PsA and distinguish them from early RA patients and non-arthritic controls. In particular, circulating levels of ApoA1 are strongly predictive for the diagnosis of PsA. The ApoA1 levels increase after 1 year in PsA patients achieving DAPSA low disease activity suggesting link with active disease. These findings suggest that specific changes in lipid profile are present in early stages of PsA and that apolipoprotein measurements might be better markers of pro-atherogenic profile in PsA than classical serum lipids.
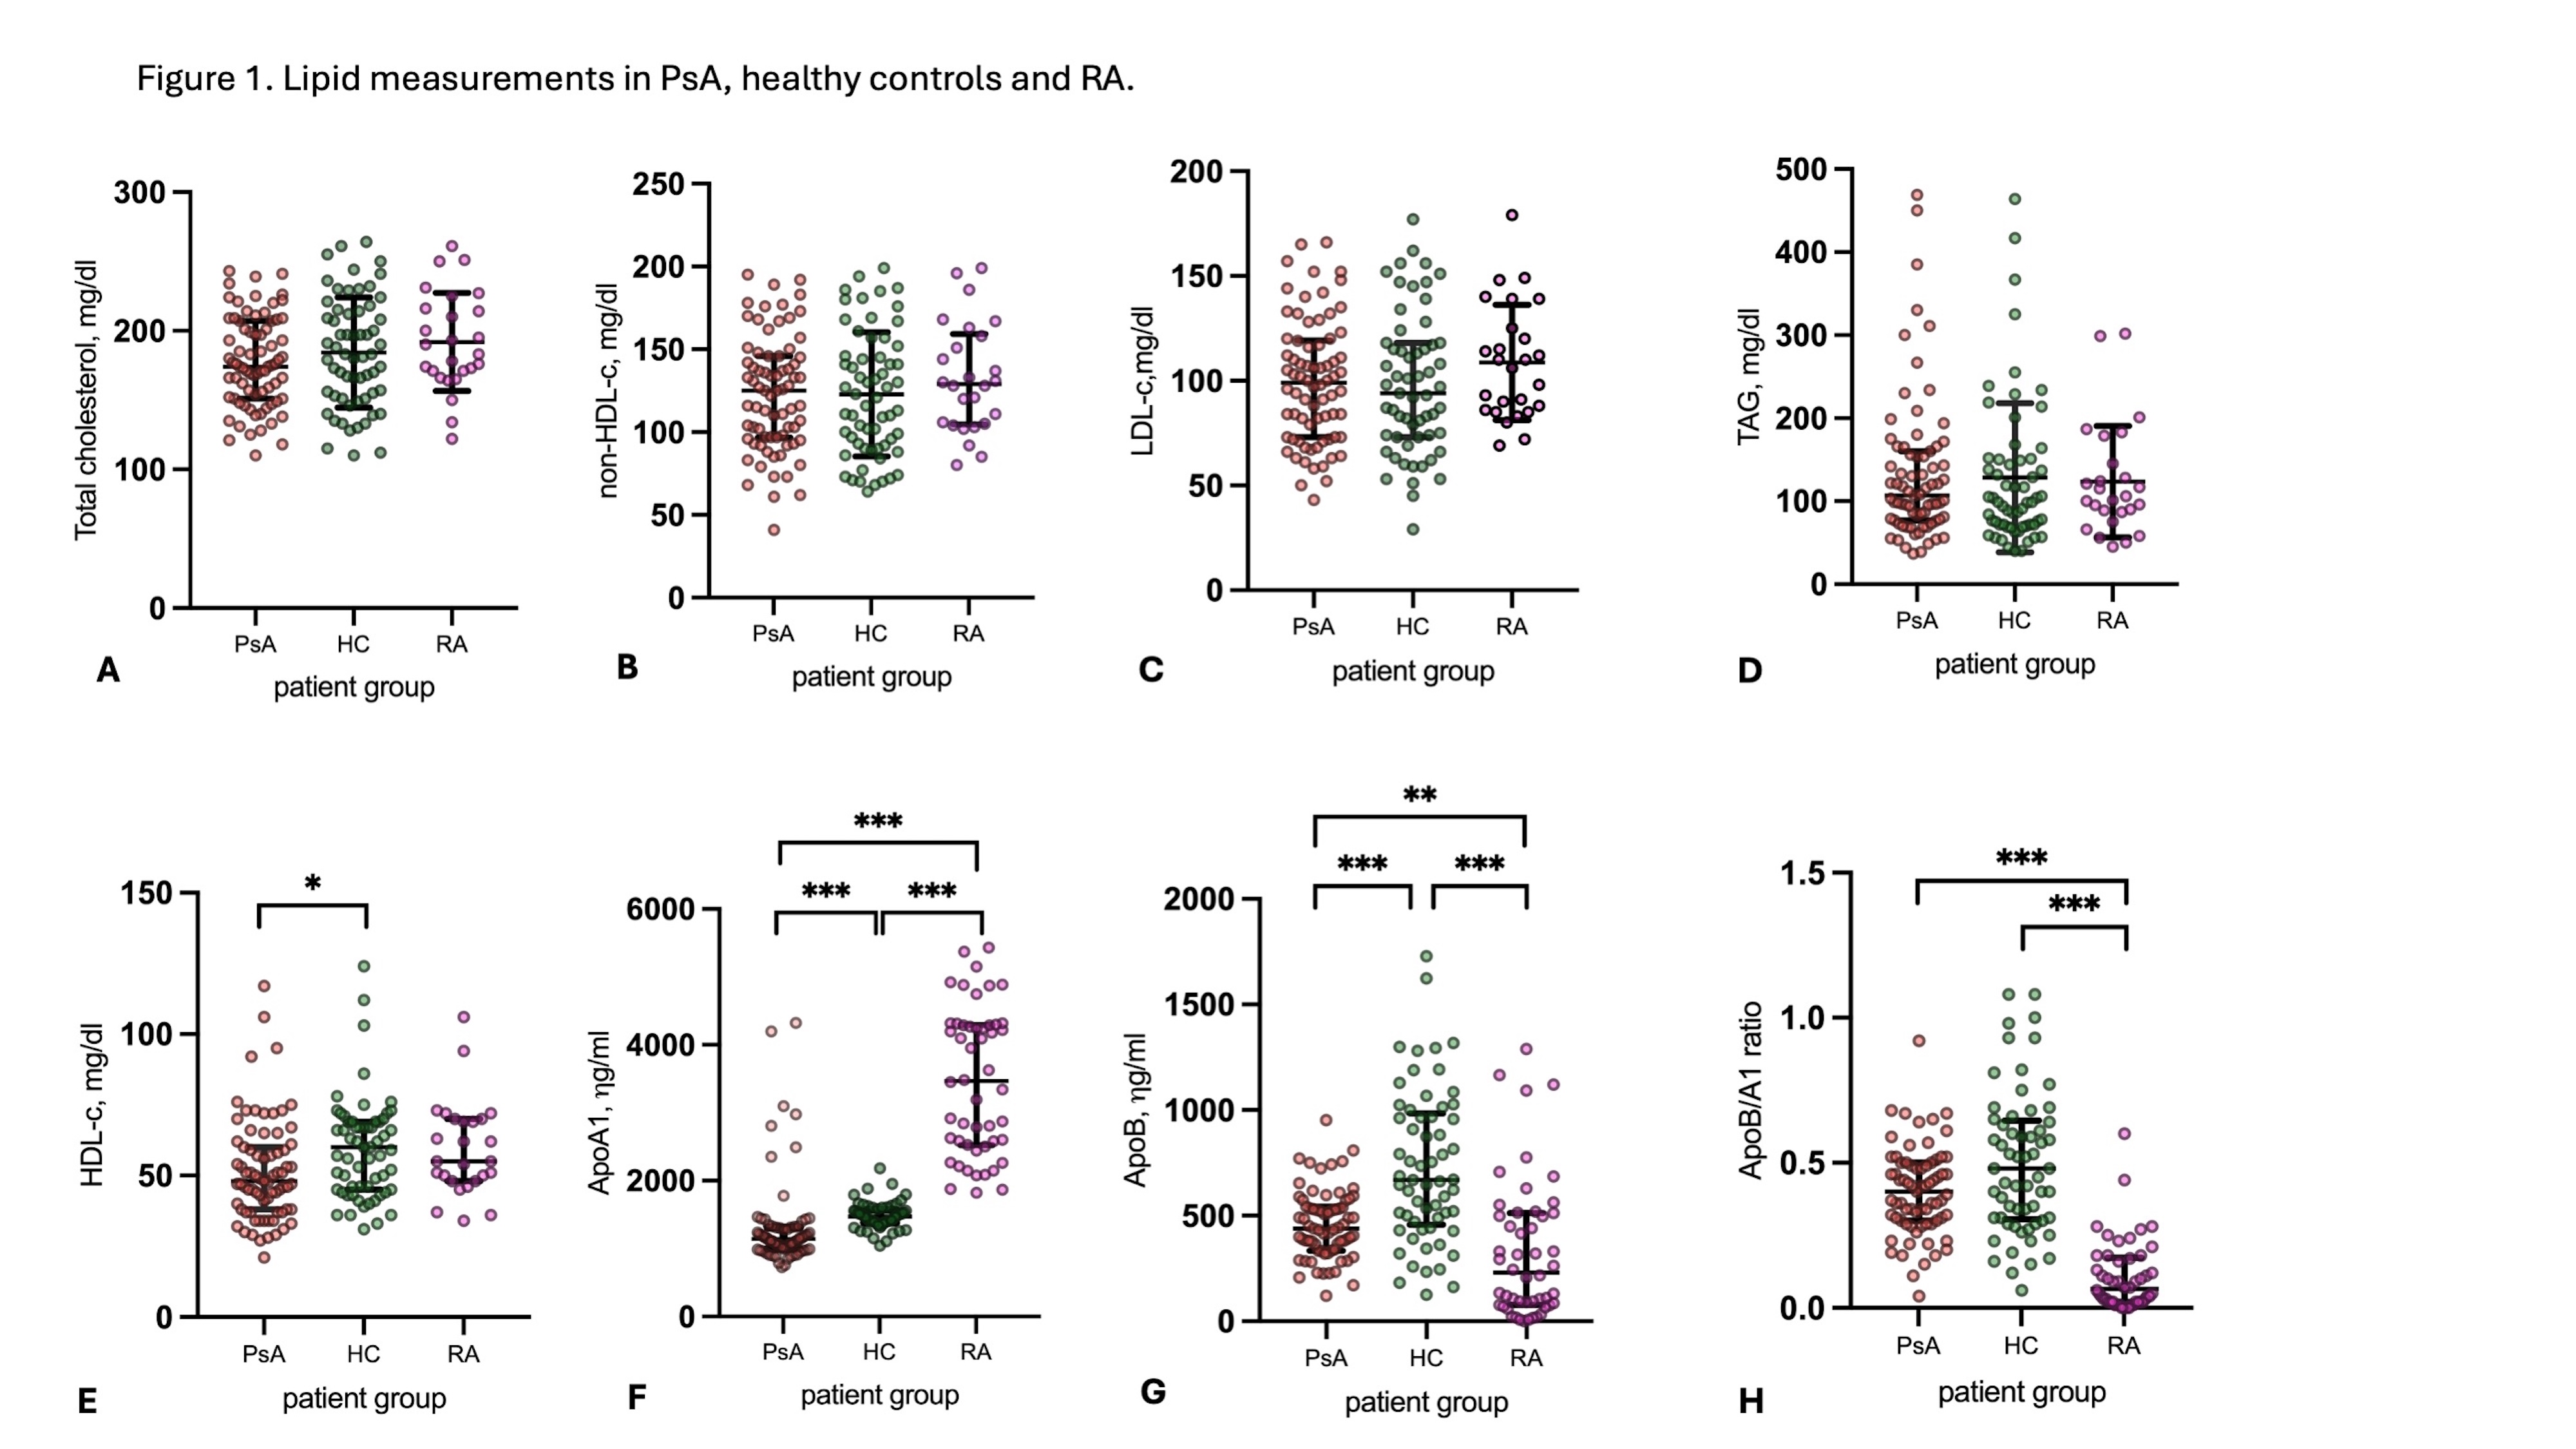 Figure 1. Lipid measurements in PsA, healthy controls and RA.
A. TC measurements (mg/dl, median[IQR]) were comparable in PsA (174[56]), RA (187 [49]) and HC(183 [63] ), p=0.205. B. non-HDL-c measurements (mg/dl, median[IQR]) in PsA (125 [49]), RA (129[55]) and HC (121[58] ), p=0.47. C. LDL-c measurements (mg/dl, median[IQR]) in PsA (99[46]), RA (108[43]) and HC (94 [45]), p=0.291. D. TAG measurements (mg/dl, median[IQR]) in PsA (107 [83]), RA (104 [70]) and HC (99[80]), p=0.734). E. HDL-c measurements (mg/dl, median[IQR]) in PsA (48 [22]), RA (55 [22]) and HC (60 [24]), p=0.006). HDL-c levels in PsA were lower as compared to HC (p=0.013), no differnce between RA vs HC and RA-PsA was observed. F. ApoA1 levels (µg/ml, median[IQR]) were lower in PsA (1141 [317]), than in HC (1473[187]) and RA (3468[1071]), , p < 0.001; p < 0.001 for all pairwise). G. Apo B levels (µg/ml, median[IQR]) were higher in PsA (438 [209]) as compared to RA (231 [436]) (p < 0.001) and lower as compared to HC (669 [528]), p < 0.001 (pairwise: PsA vs HC and RA vs HC p < 0.001, PsA vs RA p=0.009). H. ApoB/ApoA1 ratio (median(IQR] was higher in PsA (0.4 [0.2] and HC (0.5[0.3]) than in RA (0.06[0.15]), p < 0.001; pairwise PsA vs RA p < 0.001, RA vs HC p < 0.001, PsA vs HC p=0.368).
* p < 0.05; ** p < 0.001; *** P < 0.0001
.jpg) Figure 2. ROC analysis for HDL-C and ApoA1 in PsA and HC.
Figure 2. ROC analysis for HDL-C and ApoA1 in PsA and HC.
A. ROC analysis for ApoA1 and diagnosis (PSA; RA vs HC), the diagnosis of PsA being positive classifier. AUC[95%CI] 0.886 [0.83-0.941]. Overal model quality: 0.83. Sensiticity 82.4% and specificity of 83.8 % at an optimal cut off limit of 1403 g/ml .
B. ROC analysis for HDL-cholesterol and diagnosis (PSA; RA vs HC), the diagnosis of PsA being positive classifier. AUC[95%CI] 0.645 [0.83-0.941]. Overal model quality: 0.83.
.jpg) Figure 3. Change in ApoA1 and ApoB levels in patients achieving DAPSA low disease activity at 1 year-follow up.
Figure 3. Change in ApoA1 and ApoB levels in patients achieving DAPSA low disease activity at 1 year-follow up.
A. The levels of ApoA1 (µg/ml, mean(±SD)) increased at 1-year follow-up (1336±543) as compared to baseline (1160±217) in patients achieving DAPSA LDA (t1=2.5; p=0.016) and remained comparable to baseline in patients not-achieving DAPSA-LDA (baseline: 1052±67, 1-year: 1264±375; t=-2.01, p=0.106).
B. The ApoB levels were comparable at baseline (486±162) and at 1-year (482±258) in patients achieving DAPSA LDA (t=0.114; p=0.910) and not achieving DAPSA LDA (baseline: 442±160; 1-year: 551±220; t=-0.904, p=0.461).
1 – paired samples t-test was used to compare baseline and 1-year follow-up data
To cite this abstract in AMA style:
Ishchenko A, Van Mechelen M, Neerinkx B, Verschueren P, Lories R, de Vlam K. Apolipoprotein A1 and B Levels Indicate Specific Lipid Changes In Early Treatment Naïve Psoriatic Arthritis and Correlate With 1-year Disease Activity [abstract]. Arthritis Rheumatol. 2025; 77 (suppl 9). https://acrabstracts.org/abstract/apolipoprotein-a1-and-b-levels-indicate-specific-lipid-changes-in-early-treatment-naive-psoriatic-arthritis-and-correlate-with-1-year-disease-activity/. Accessed .« Back to ACR Convergence 2025
ACR Meeting Abstracts - https://acrabstracts.org/abstract/apolipoprotein-a1-and-b-levels-indicate-specific-lipid-changes-in-early-treatment-naive-psoriatic-arthritis-and-correlate-with-1-year-disease-activity/