Session Information
Date: Sunday, November 8, 2020
Title: RA – Treatments Poster III: PROs, Biomarkers, Systemic Inflammation & Radiographs
Session Type: Poster Session C
Session Time: 9:00AM-11:00AM
Background/Purpose: A prior post hoc analysis of tofacitinib clinical trial data reported improvements in RA outcomes with tofacitinib vs placebo (PBO) through Month (M)6, regardless of baseline (BL) BMI.1 This post hoc analysis assessed change from BL (∆) in BMI, and disease activity by BL BMI status, in patients (pts) with moderate/severe RA receiving tofacitinib through M12.
Methods: Data were pooled from Phase 3 and 3b/4 studies of pts who were MTX-naïve (NCT01039688), or inadequate responders to conventional synthetic (cs) or biologic DMARDs (NCT00960440; NCT00847613; NCT00814307; NCT00856544; NCT00853385; NCT02187055; NCT02831855). Pts received ≥ 1 dose of tofacitinib 5 or 10 mg twice daily (BID), or 11 mg once daily (QD), alone or with background csDMARDs, or PBO. Least squares (LS) mean ∆BMI (linear mixed model repeated measures; observed cases) was summarized for all treatment groups at M3/6/12 (M3/6 only for tofacitinib 11 mg QD and PBO). Other assessments at M3/6/12 included ∆BMI +/‑ BL concomitant glucocorticoids (GC) or antidepressants (descriptive statistics only), LS mean ∆DAS28‑4(ESR), stratified by BL BMI status (< 25, ≥ 25 – < 30, ≥ 30), and correlations between LS mean ∆BMI and ∆DAS28‑4(ESR).
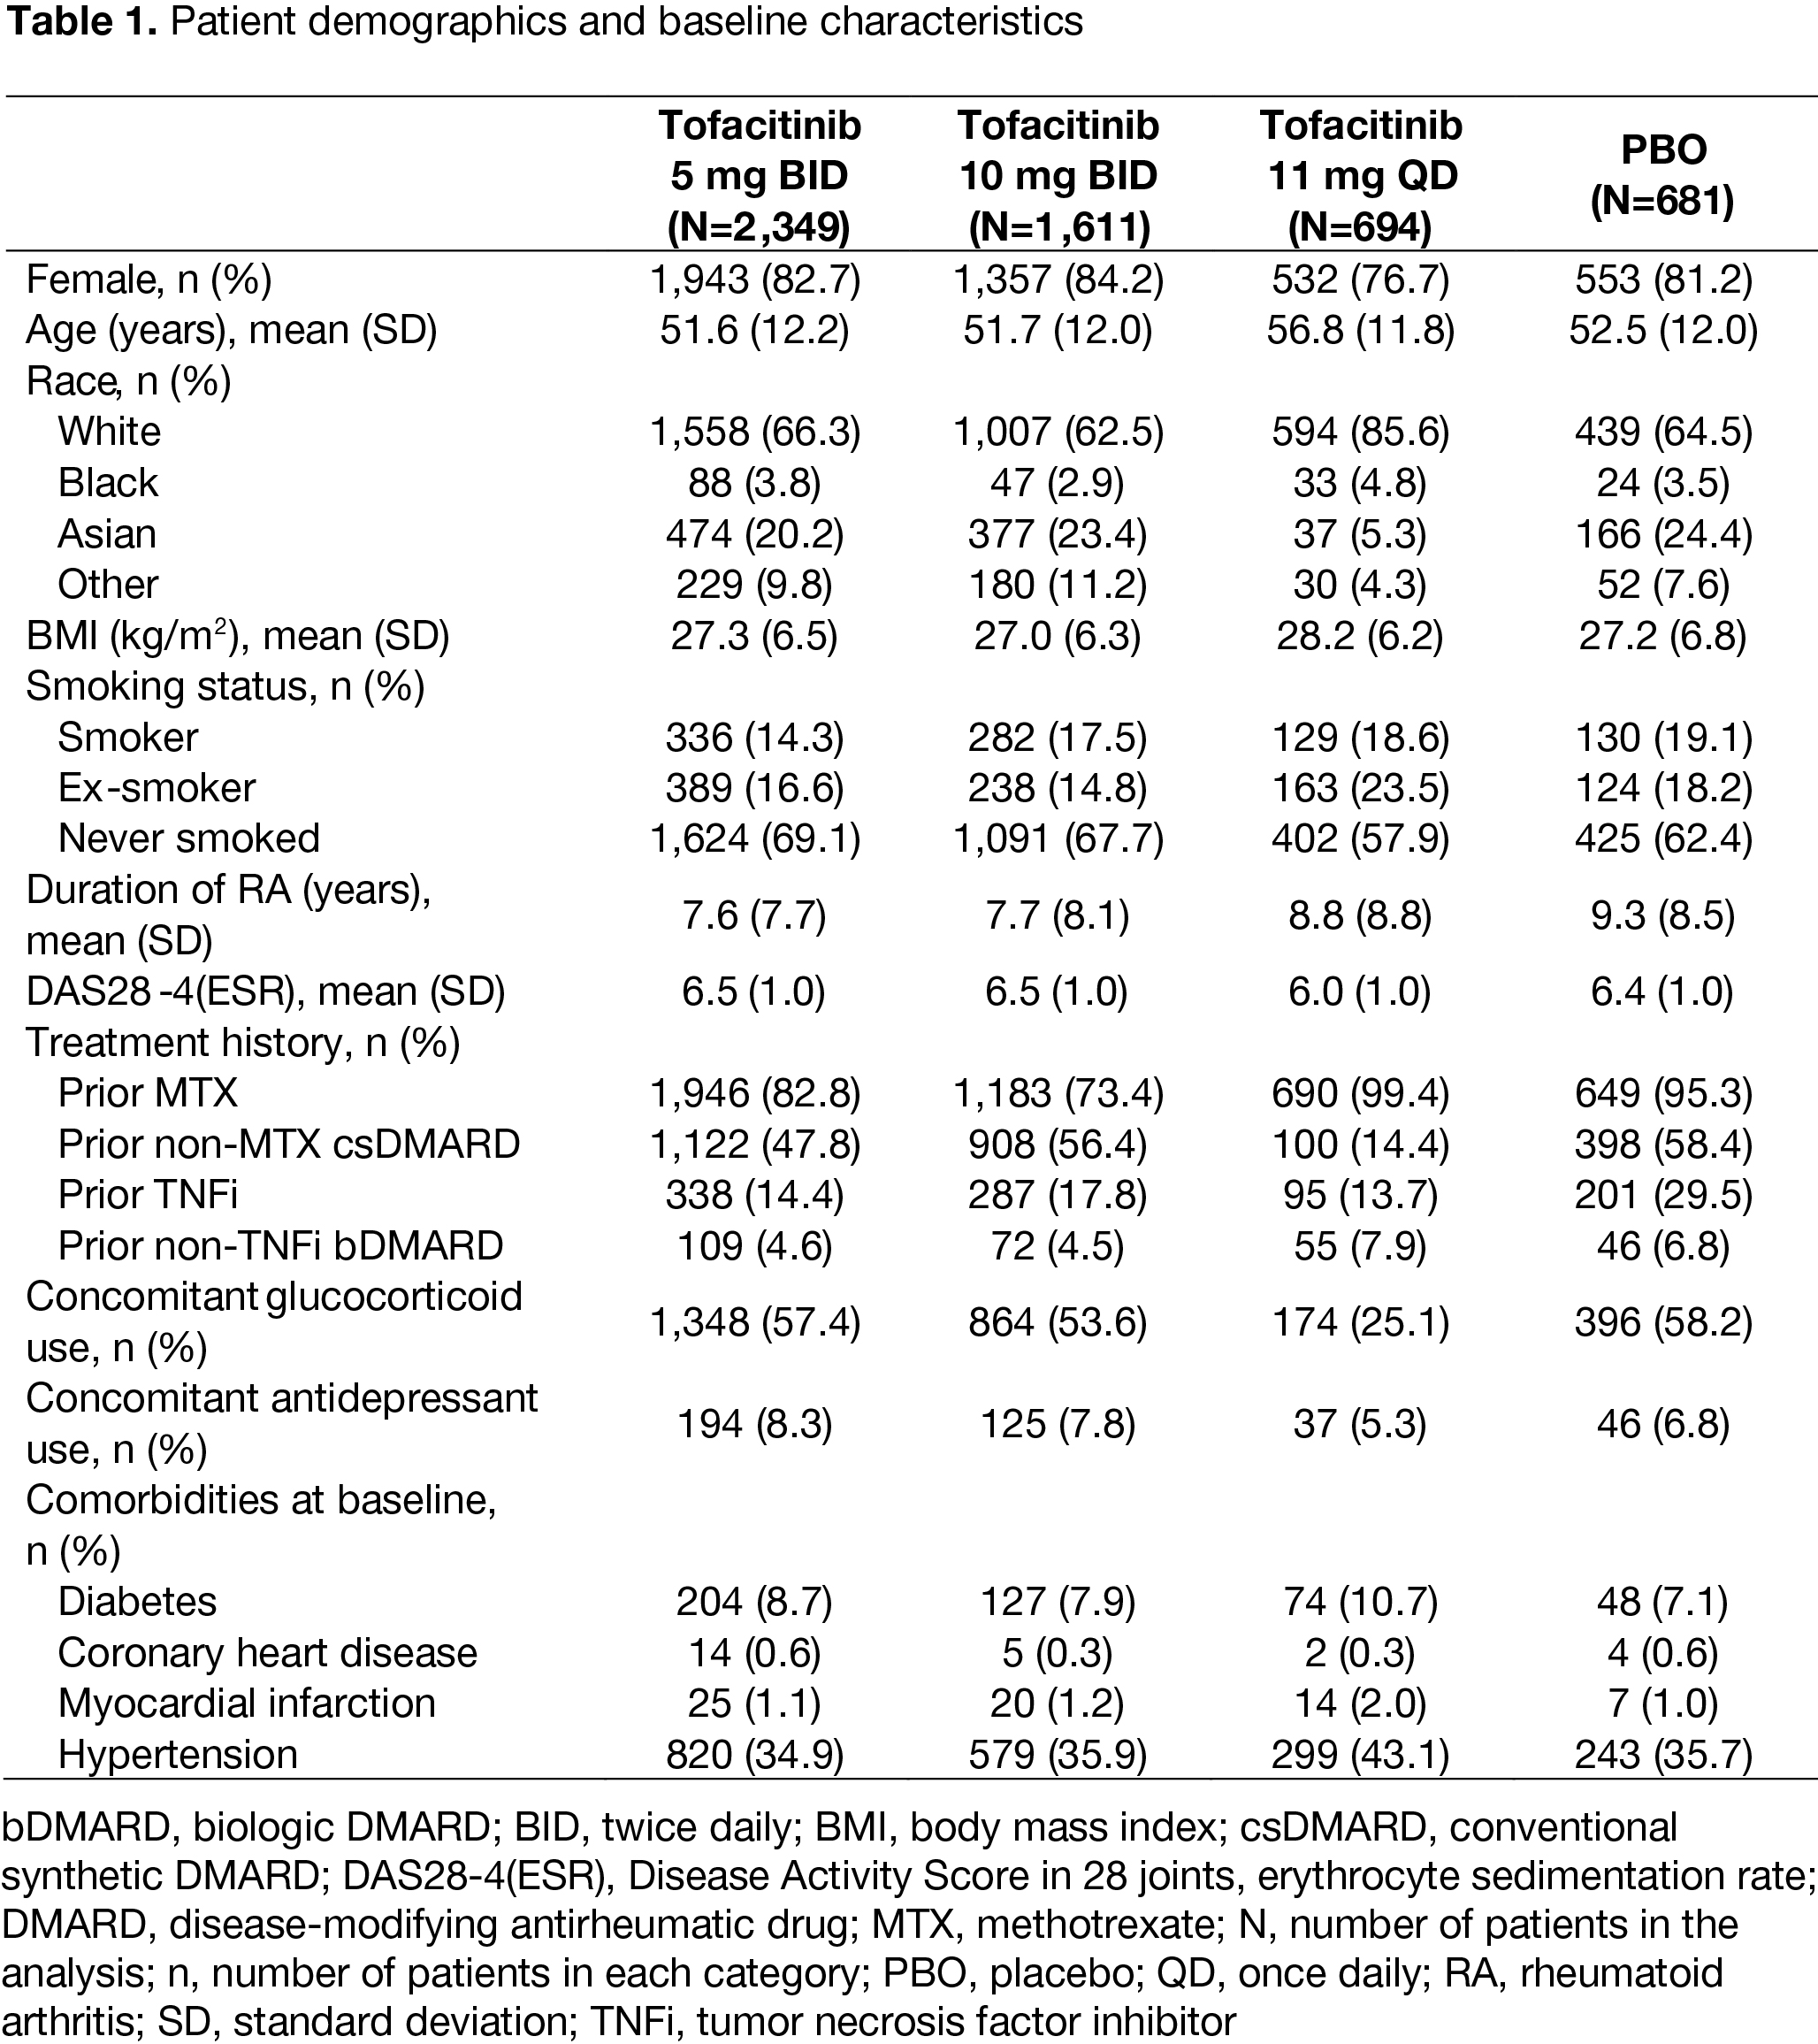
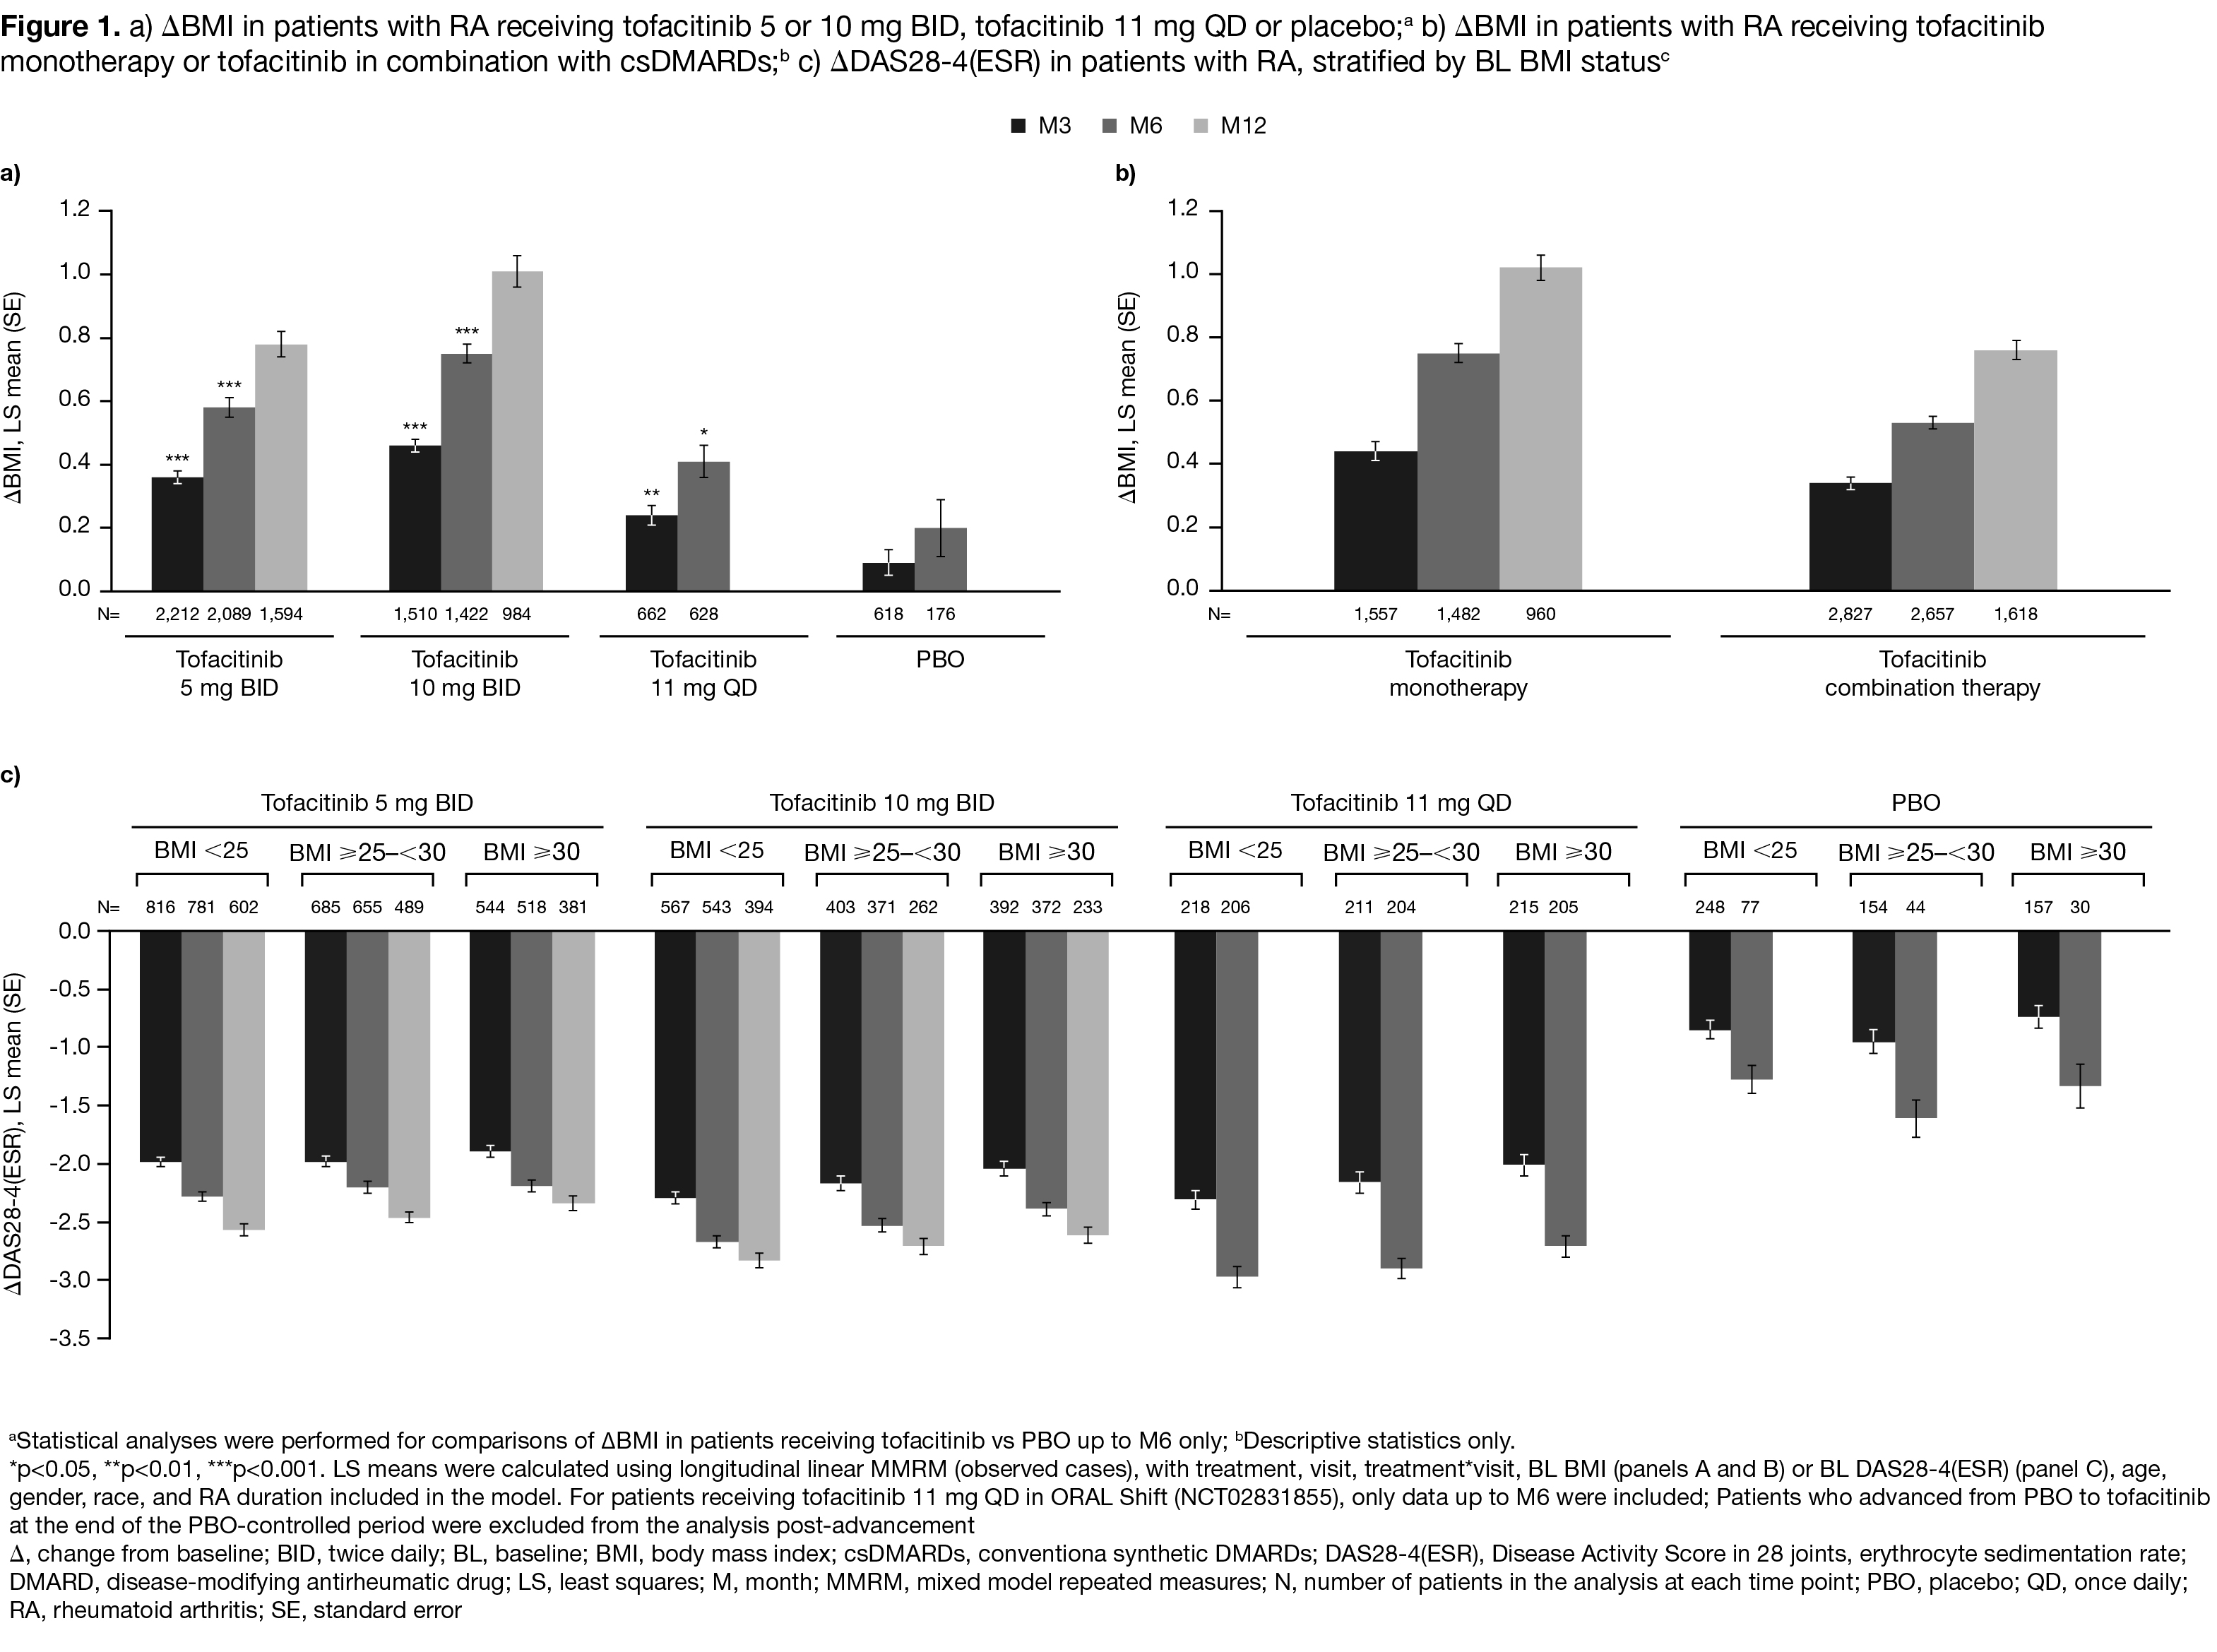
Results: In total, 2,349, 1,611, 694, and 681 pts received tofacitinib 5 mg BID, 10 mg BID, 11 mg QD, or PBO, respectively. Demographics and baseline characteristics were generally similar across treatment groups, except in pts receiving tofacitinib 11 mg QD, where some differences were observed in gender, race, and concomitant GC use (Table 1). At M3/6, LS mean BMI significantly increased from BL with all tofacitinib doses vs PBO (all p< 0.05); ∆BMI was greatest with 10 mg BID, and lowest with 11 mg QD (Figure 1a). LS mean ∆BMI was greater in pts receiving tofacitinib as monotherapy vs combination therapy at M3/6/12 (Figure 1b). ∆BMI was generally similar in pts receiving treatment +/‑ concomitant GCs or antidepressants (data not shown). Improvements in DAS28‑4(ESR) scores were observed in each BL BMI status group at M3/6/12, and were greatest with all tofacitinib doses vs PBO. LS mean ∆DAS28‑4(ESR) was generally numerically highest for pts with BMI < 25 and numerically lowest for pts with BMI > 30, for all tofacitinib doses. LS mean ∆DAS28‑4(ESR) was also generally greatest with tofacitinib 10 mg BID and 11 mg QD vs 5 mg BID across BL BMI status groups (Figure 1c). Across treatment groups, model-adjusted associations between ∆DAS28-4(ESR) scores and ∆BMI were weak (correlation coefficients all < 0.3; Table 2).
Conclusion: ∆BMI was greater with tofacitinib (all doses) vs PBO at M3/6, and with tofacitinib monotherapy vs combination therapy at M3/6/12. Improvements in DAS28‑4(ESR) were seen across all BL BMI status groups. BMI increases with tofacitinib were only weakly associated with DAS28-4(ESR) improvements. The relationship between disease activity and ∆BMI requires further investigation.
- Dikranian A et al. Arthritis Rheumatol 2018; 69 (suppl 10).
Acknowledgments: Study sponsored by Pfizer Inc. Medical writing support was provided by Anthony G. McCluskey, CMC Connect, and funded by Pfizer Inc.
To cite this abstract in AMA style:
Wollenhaupt J, Morel J, Daien C, Ruyssen-Witrand A, Lukas C, Richez C, Shapiro A, Chapman D, Cros M, Rivas J, Citera G. Analysis of the Impact of Tofacitinib Treatment on Weight in Patients with Rheumatoid Arthritis [abstract]. Arthritis Rheumatol. 2020; 72 (suppl 10). https://acrabstracts.org/abstract/analysis-of-the-impact-of-tofacitinib-treatment-on-weight-in-patients-with-rheumatoid-arthritis/. Accessed .« Back to ACR Convergence 2020
ACR Meeting Abstracts - https://acrabstracts.org/abstract/analysis-of-the-impact-of-tofacitinib-treatment-on-weight-in-patients-with-rheumatoid-arthritis/


