Session Information
Date: Monday, November 14, 2022
Title: Abstracts: SLE – Diagnosis, Manifestations, and Outcomes III: Genetic Factors
Session Type: Abstract Session
Session Time: 3:00PM-4:30PM
Background/Purpose: To characterize the molecular landscape of patients with Type 1 and Type 2 systemic SLE erythematosus (SLE) by analyzing gene expression profiles from peripheral blood.
Methods: Full transcriptomic RNA sequencing was carried out on whole blood samples from 18 subjects with SLE selected by manifestations of Type 1 and Type 2 SLE as determined by SLE Disease Activity Index (SLEDAI) and Polysymptomatic Distress (PSD) score, respectively. The top 5,000 row variance genes were input to Multiscale Embedded Gene Co-expression Network Analysis (MEGENA). Modules were functionally annotated based on gene symbol overlaps of curated cell types and biological functions, and module eigengenes correlated to various demographic traits, clinical features and laboratory assays. The STRING database was queried to calculate the density of protein-protein interactions (PPIs) within modules. Gene Set Variation Analysis (GSVA) was used with the top 30 MEGENA modules correlating to Type 1/2 SLE as inputs, and patient segregation based on GSVA enrichment scores calculated using stable k-means clustering. Coexpression modules were queried for overlap with those of inactive SLE patients (SLEDAI< 6), GSE45291 (244 patients) & GSE49454 (177 patients) and patients with fibromyalgia (FM) in GSE67311. Differential Gene Correlation Analysis (DGCA) was employed to calculate the top totaled intermodular connections unique to Type 1 & Type 2 SLE.
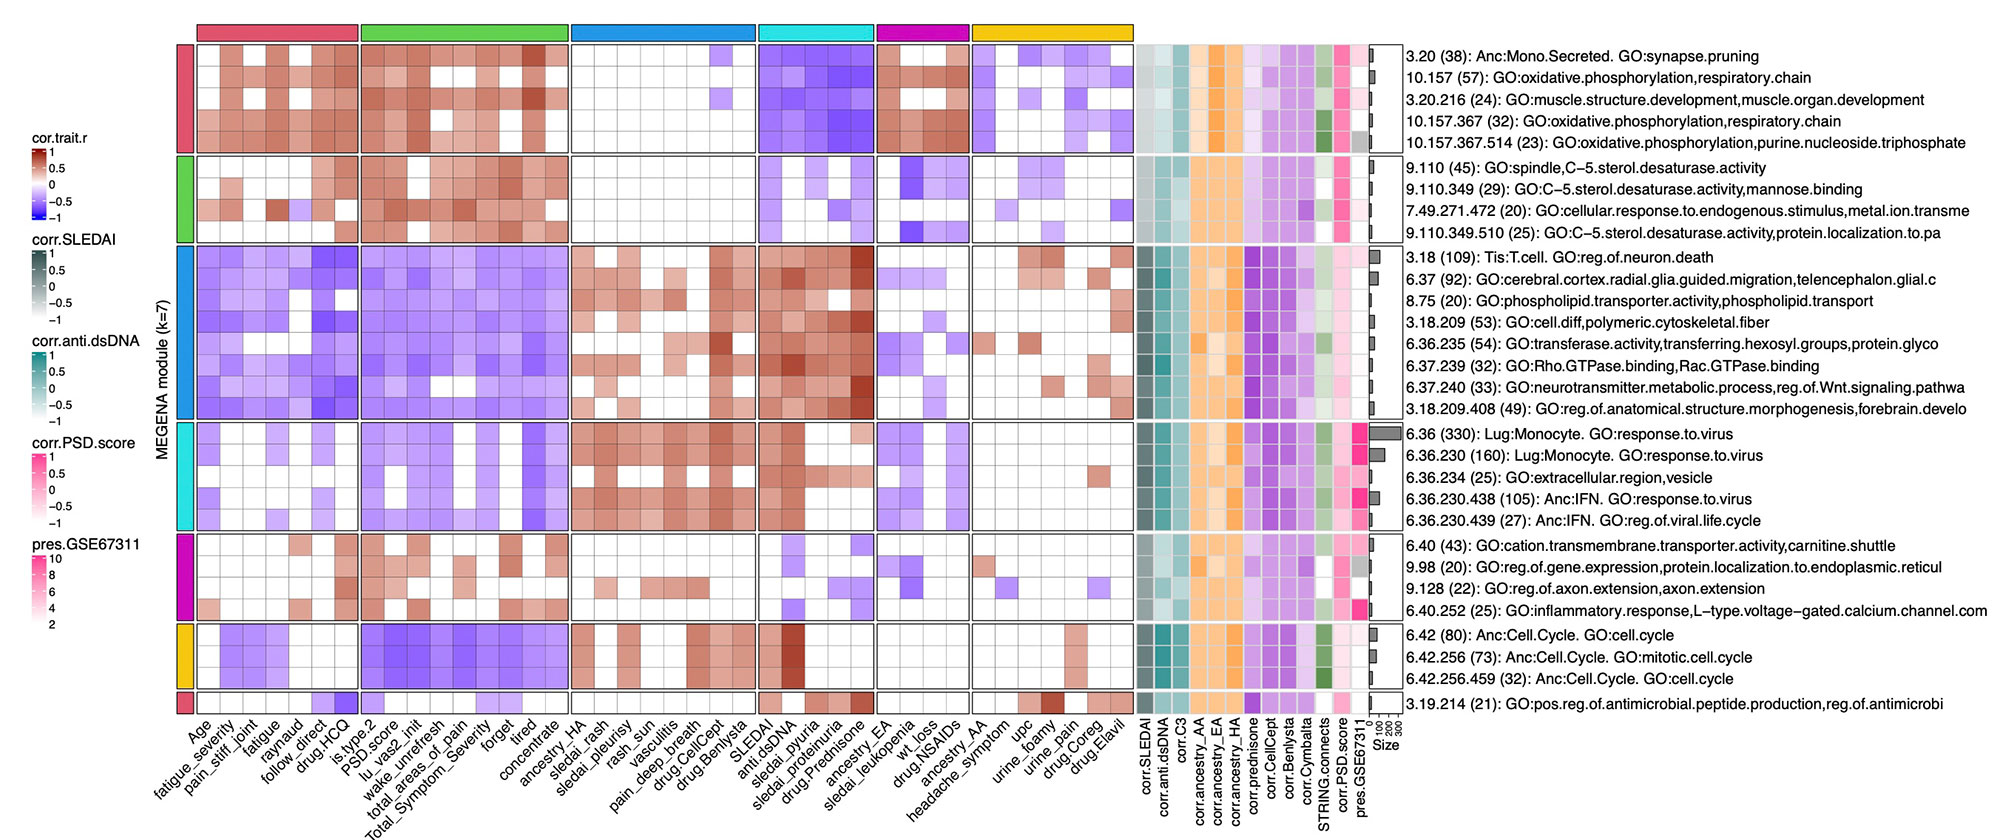
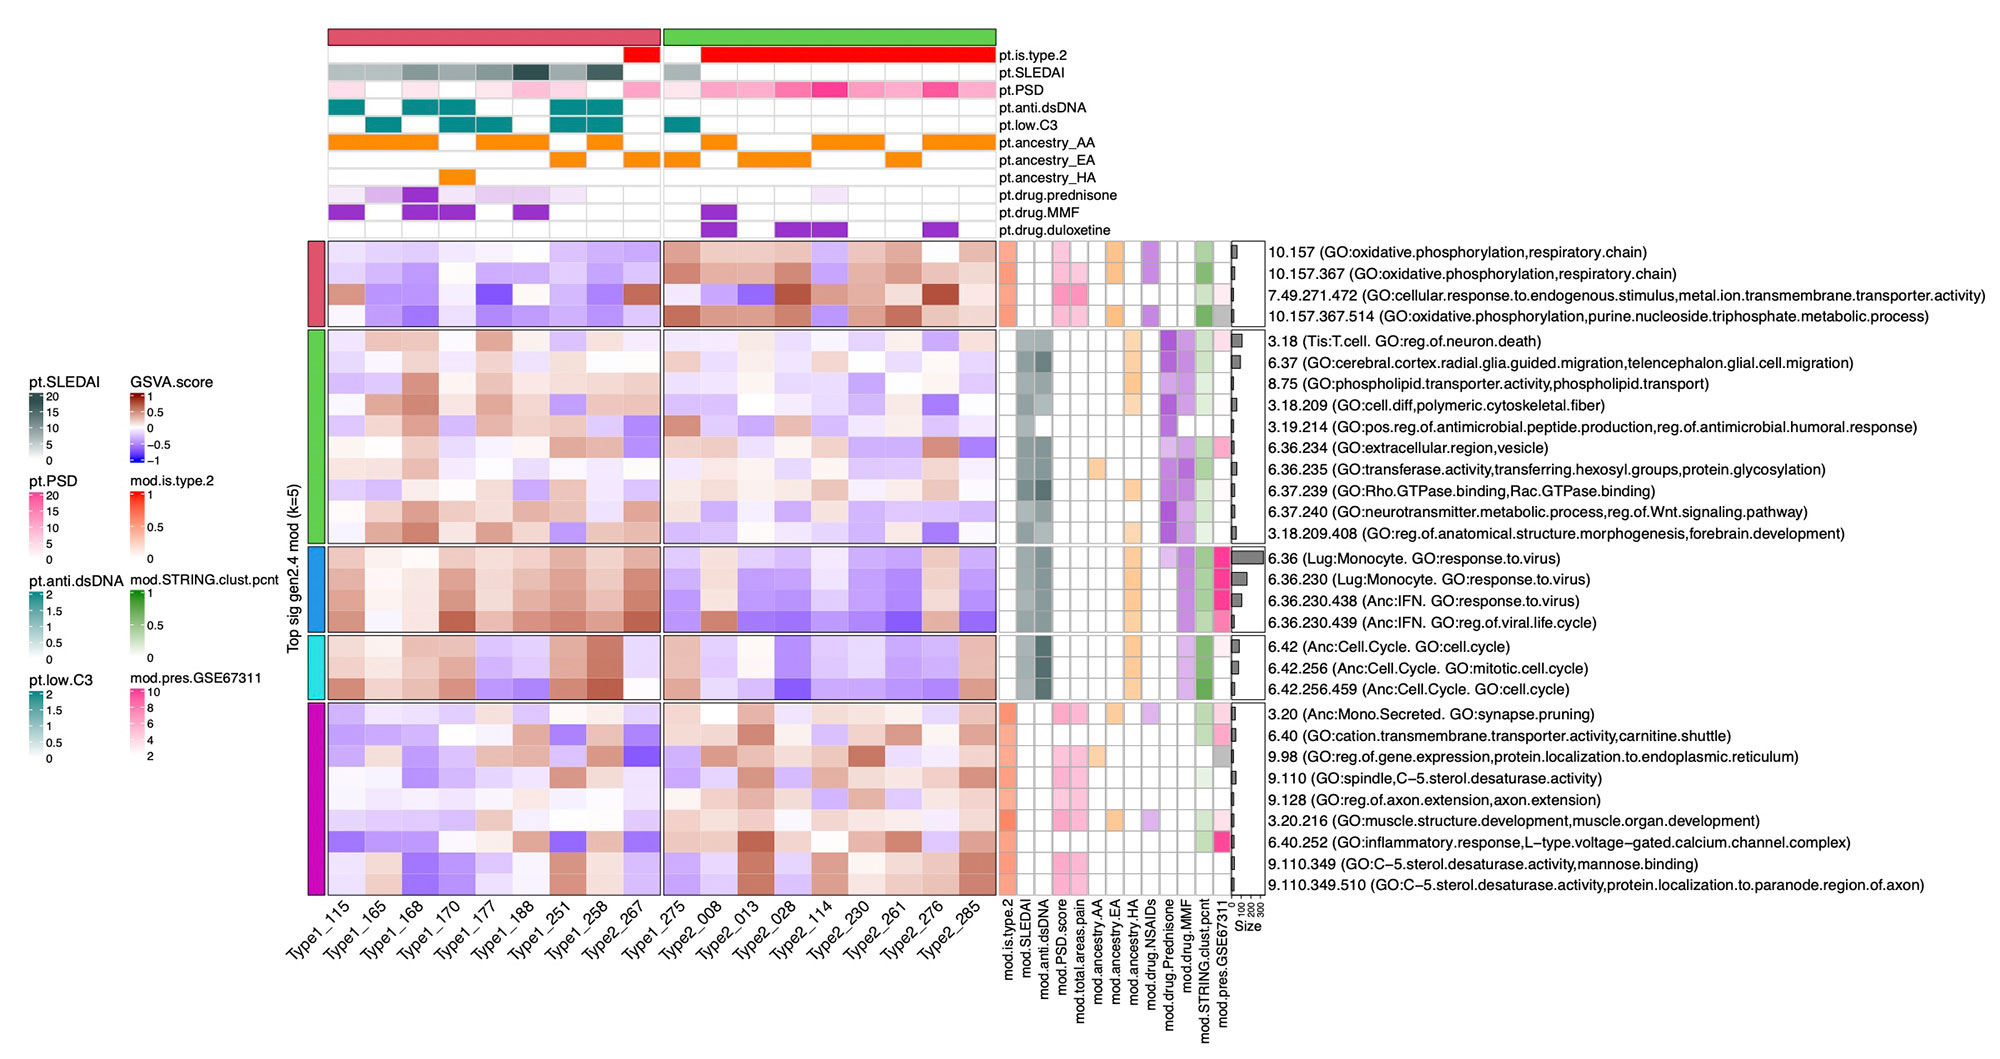
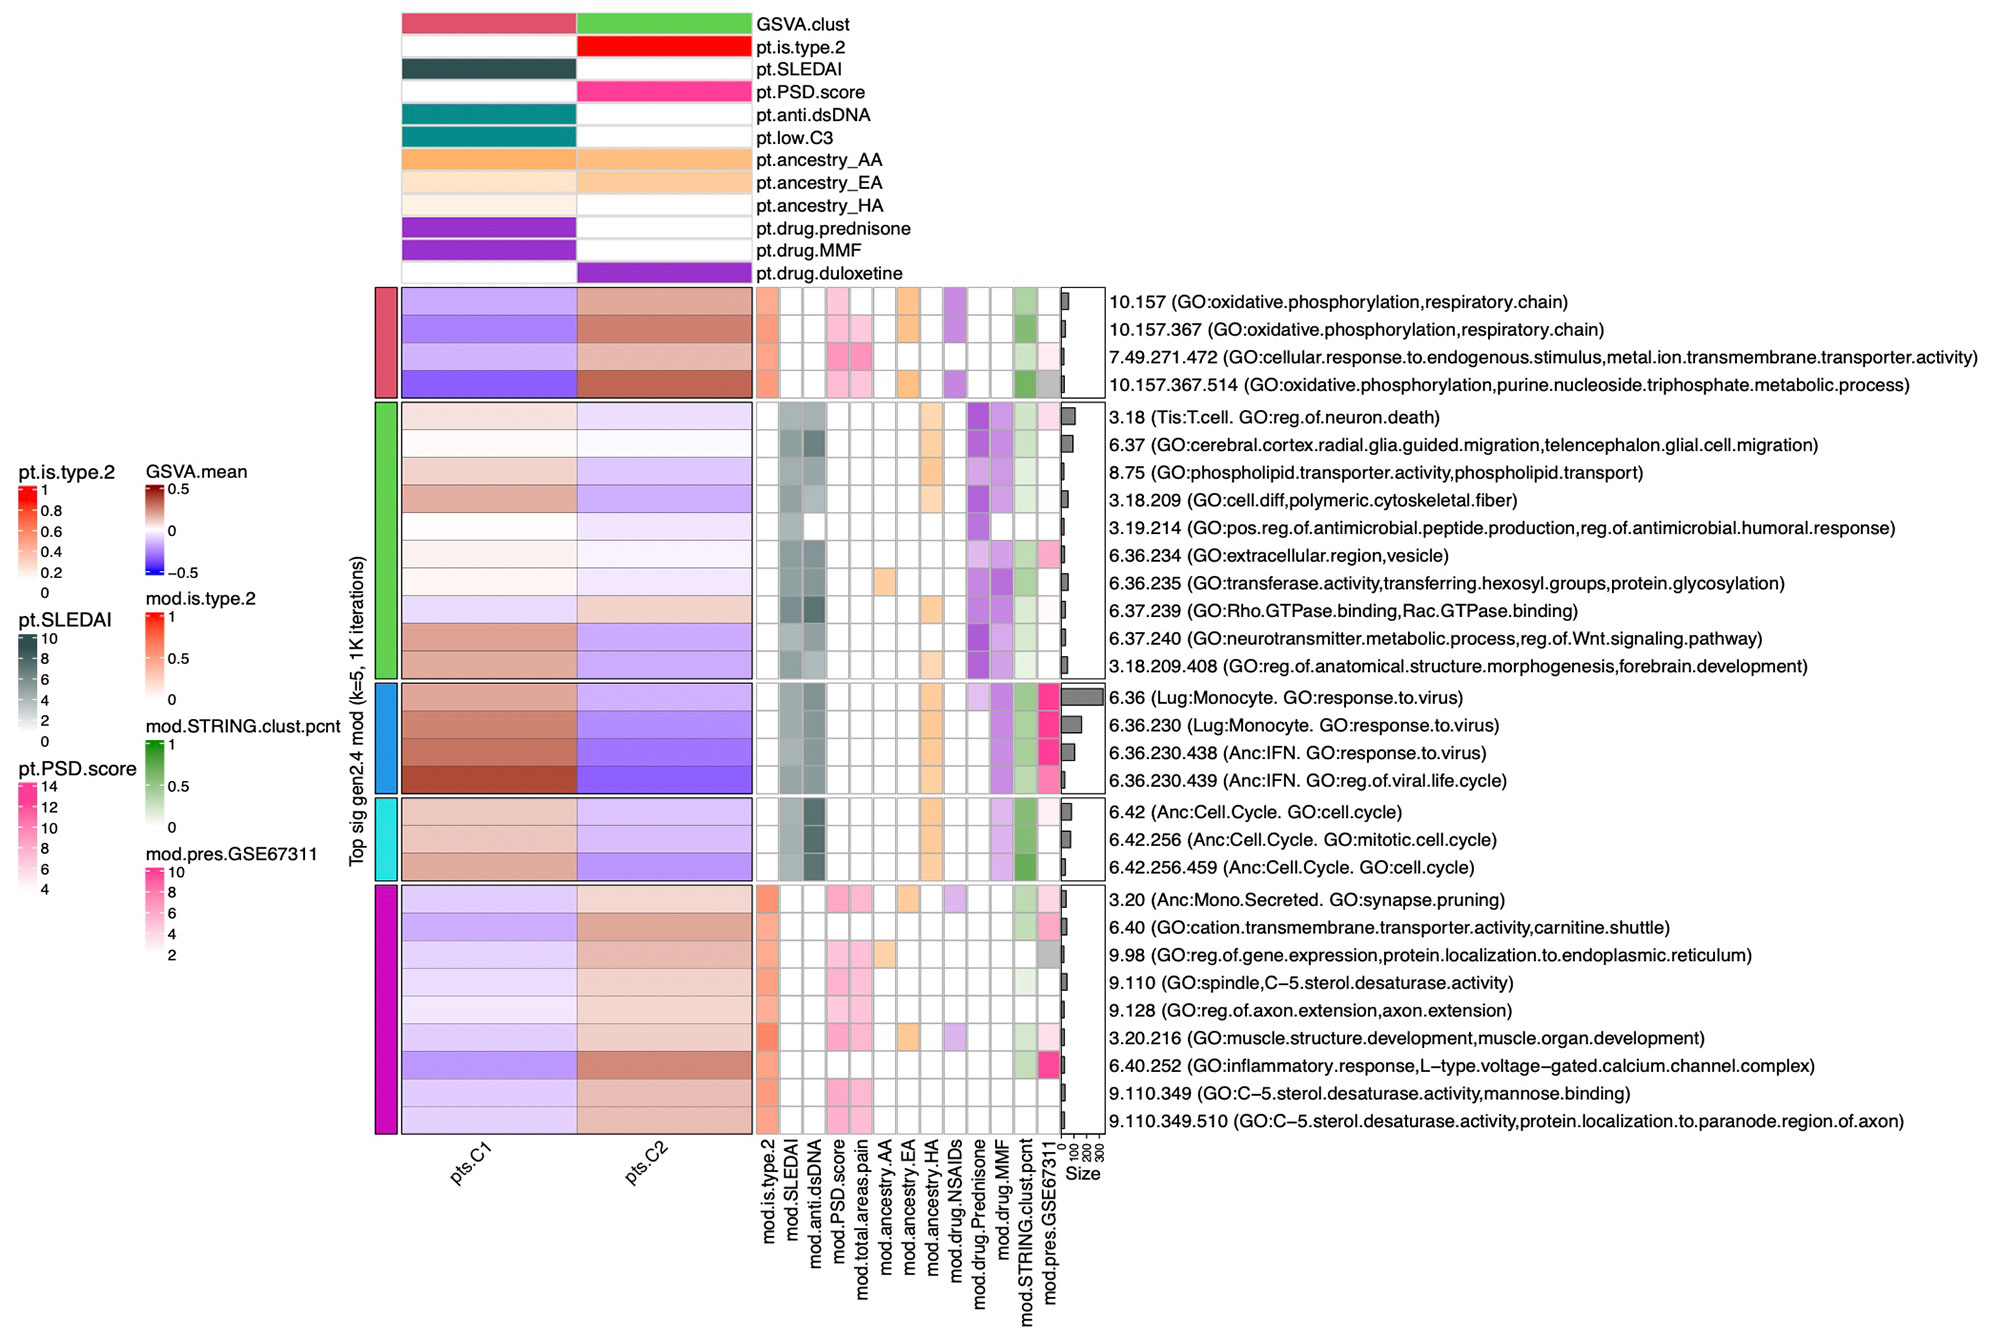
Results: MEGENA generated 153 coexpression modules amongst which the top 30 modules most highly correlated to cohort were used for ensuing analysis. Stable k-means clustering of gene coexpression module correlations revealed unique groupings of clinical traits and molecular functions (Figure 1). Modules highly correlated to SLEDAI also highly correlated to anti-dsDNA, pyuria, proteinuria, and prednisone usage, whereas modules highly correlated to PSD score also highly correlated to total areas of pain, waking up unrefreshed, forgetfulness, fatigue, and lack of concentration. Stable k-means clustering of GSVA enrichment scores effectively segregated Type 1 from Type 2 SLE and validated the clinical and molecular functions unique to the Type 1/2 SLE (Figure 2). STRING found 20 modules exhibiting 10-50% PPI intraconnectedness and 5 having > 50%, confirming that the co-expression modules have captured known molecular pathways in an unsupervised manner. Unique Type 1 SLE enrichments identified using MEGENA module annotations and largely validated by DGCA included IFN, neutrophils, monocytes, IL-1, TNF, cell cycle, and neurotransmitter pathways, whereas unique Type 2 SLE enrichments included B cells, plasma cells, Ig chains, and neuromuscular pathways. Enrichment of the IFN signature was not observed in Type 2 SLE. Gene expression patterns of some Type 2 SLE patients were identified amongst gene expression profiles reported in the literature for inactive SLE and idiopathic FM patients.
Conclusion: A suite of orthogonal gene coexpression technologies successfully identified unique transcriptional patterns that segregate Type 1 SLE from Type 2 SLE, and further identified Type 2 molecular features in additional patients with inactive SLE or FM.
To cite this abstract in AMA style:
Robl R, Eudy A, Bachali P, Rogers J, Clowse M, Pisetsky D, lipsky P. The Molecular Endotypes of Type 1 and Type 2 SLE [abstract]. Arthritis Rheumatol. 2022; 74 (suppl 9). https://acrabstracts.org/abstract/the-molecular-endotypes-of-type-1-and-type-2-sle/. Accessed .« Back to ACR Convergence 2022
ACR Meeting Abstracts - https://acrabstracts.org/abstract/the-molecular-endotypes-of-type-1-and-type-2-sle/


