Session Information
Session Type: Abstract Submissions (ACR)
Background/Purpose: Current recommendations for management of RA propose a tumor necrosis factor alpha inhibitor (TNFi) for patients failing to achieve the treatment target with synthetic DMARDs. If 1st TNFi fails, a different TNFi, abatacept, rituximab (RTX) or tocilizumab (TCZ) are equally recommended. It has been shown that non TNFi biologics are at least as effective as the TNFi in this setting. Since there is little is known about the survival of 2nd biologic agent, we decided to investigate the survival of the 2nd biologic after switching from the 1st TNFi.
Methods : Data was extracted from the mandatory nationwide registry of patients with rheumatoid arthritis treated with biologics on Dec 15th, 2012. Kaplan Meier survival analysis was performed. Statistical significance was determined using the Log-Rank and Wilcoxon tests.
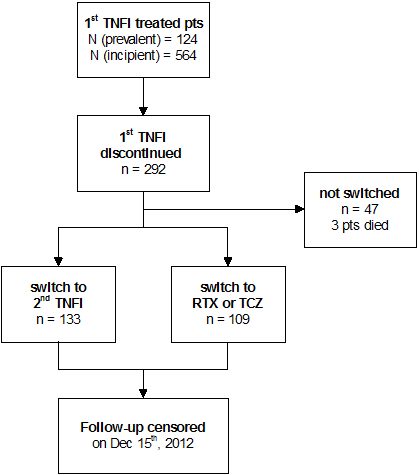
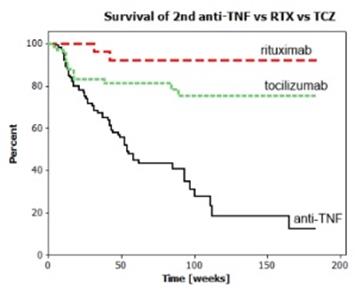
Results : From the dataset collected between February 2007 and December 2012 we identified 688 RA patients who received TNFi as a first biologic. Flow of patients is depicted in Figure 1. Baseline patient characteristics are shown in Table 1. The 1st TNFi was stopped for inefficiency, adverse events, other reasons, and death in 73,4%, 16.7%, 8.7%, and 1.0%, respectively. Kaplan Meier survival curves for 2nd TNFi (as a group), RTX and TCZ are presented in Figure 2. 2nd TNFi failed due to insufficient efficacy in 90%, and adverse events in 8%.
Figure 1
Table 1
|
|
|
|
|
|
||||||||
|
Line of biologic DMARD |
1st |
|
2nd |
|
|
|
||||||
|
|
|
|
|
|
|
|
|
|||||
|
Biologic DMARD |
iTNF |
|
iTNF |
Rituximab |
Tocilizumab |
|
|
|||||
|
|
|
|
|
|
|
|
|
|||||
|
Patients |
688 |
|
133 |
34 |
75 |
|
|
|||||
|
iTNF used |
|
|
|
|
|
|
|
|||||
|
% adalimumab |
43.6 |
|
33.8 |
/ |
/ |
|
|
|||||
|
% etanercept |
30.7 |
|
39.9 |
/ |
/ |
|
|
|||||
|
% infliximab |
10.7 |
|
9.8 |
/ |
/ |
|
|
|||||
|
% certolizumab |
9.9 |
|
15.0 |
/ |
/ |
|
|
|||||
|
% golimumab |
5.1 |
|
1.5 |
/ |
/ |
|
|
|||||
|
|
|
|
|
|
|
|
|
|||||
|
Gender (% female) |
81.5 |
|
78.2 |
76.5 |
90.7 |
p=0.056‡ |
|
|||||
|
mean age at starting bio-DMARD [yr] (SD) |
54.7 (11,5) |
|
55.0 (11.4) |
56.9 (12.2) |
57.6 (11.3) |
p=0.272* |
|
|||||
|
mean age at diagnosis [yr] (SD) |
45.2 (11.8) |
|
45.2 (11.4) |
45.5 (11.8) |
45.7 (12.0) |
p=0.948* |
|
|||||
|
|
|
|
|
|
|
|
|
|||||
|
mean time to bioDMARD [yr] (SD) |
9.8 (8.1) |
|
9.9 (6.9) |
10.6 (7.0) |
11.9 (8.4) |
p=0.286† |
|
|||||
|
|
|
|
|
|
|
|
|
|||||
|
% RF positive |
81,8 |
|
81.2 |
91.2 |
77.3 |
p=0.227‡ |
|
|||||
|
%ACPA positive |
77.0 |
|
73.7 |
96.5 |
74.5 |
p=0.008‡ |
|
|||||
|
% with history of smoking |
26.2 |
|
28.6 |
29.4 |
28.0 |
p=0.988‡ |
|
|||||
|
% current |
15.1 |
|
18.9 |
23.5 |
18.7 |
p=0.808‡ |
|
|||||
|
% past |
11.1 |
|
9.8 |
5.9 |
9.3 |
p=0.777‡ |
|
|||||
|
prior synth–DMARDs median (Q1;Q3) |
3 (3;4) |
|
4 (3;4) |
4 (3;5) |
4 (3;5) |
p=0.313† |
|
|||||
|
% concomitatnt DMARD |
82.0 |
|
72.2 |
79.4 |
80.0 |
p=0.290‡ |
|
|||||
|
% methotrexate |
71.1 |
|
55.6 |
79.4 |
68.0 |
p=0.020‡ |
|
|||||
|
mean methotrexate dose [mg] (SD) |
17.4 (4.2) |
|
16.8 (3.6) |
17.6 (3.3) |
16.1 (3.3) |
p=0.252* |
|
|||||
|
% leflunomide |
10.5 |
|
15.8 |
0.0 |
12.0 |
p=0.044‡ |
|
|||||
|
% concomitant prednisolone |
45.3 |
|
48.1 |
41.2 |
52.0 |
p=0.576‡ |
|
|||||
|
mean prednisolone dose [mg] (SD) |
6.9 (3.4) |
|
7.3 (3.3) |
7.7 (3.0) |
5.7 (1.9) |
p=0.011* |
|
|||||
|
|
|
|
|
|
|
|
|
|||||
|
Mean baseline disease activity |
|
|
|
|
|
|
|
|||||
|
DAS28ESR (SD) |
6.4 (1.0) |
|
6.1 (1.1) |
6.3 (1.0) |
6.5 (1.0) |
p=0.043* |
|
|||||
|
DAS28CRP (SD) |
5.9 (1.0) |
|
5.7 (1.1) |
5.8 (1.1) |
6.0 (1.0) |
p=0.139* |
|
|||||
|
Promis HAQ (SD) |
44.7 (24.3) |
|
41.1 (22.7) |
42.1 (25.0) |
48.6 (23.7) |
p=0.094* |
|
|||||
|
ESR [mm/h] (SD) |
39.4 (22.6) |
|
38.1 (24.2) |
42.2 (25.5) |
21.7 (25.1) |
p=0.469† |
|
|||||
|
CRP [mg/L] (SD) |
23.5 (28.2) |
|
24.7 (27.1) |
35.1 (37.7) |
23.0 (2.4) |
p=0.404† |
|
|||||
|
PGA (0-100) (SD) |
66.9 (22.9) |
|
66.0 (23.8) |
64.1 (18.7) |
70.5 (20.9) |
p=0.151† |
|
|||||
|
Pain (0-100) (SD) |
67.7 (22.0) |
|
66.7 (21.5) |
62.2 (21.9) |
63.9 (22,3) |
p=0.678† |
|
|||||
|
EGA (0-100) (SD) |
62.0 (22.5) |
|
59.9 (21.5) |
63.3 (19.7) |
65.7 (19.5) |
p=0.132† |
|
|||||
|
TJC28 (SD) |
14.3 (6.6) |
|
12.6 (6.9) |
12.7 (6.9) |
14.8 (6.2) |
p=0.033† |
|
|||||
|
SJC28 (SD) |
12.8 (5.5) |
|
12.4 (6.7) |
13.2 (5.3) |
12.9 (5.8) |
p=0.632† |
|
|||||
|
|
|
|
|
|
|
|
|
|||||
Figure 2
Conclusion : After the 1st TNFi fails, a 2nd TNFi is more likely to fail earlier than RTX or TCZ (p=0.000). There is a trend of better survival of RTX vs TCZ, which did not reach statistical significance (p=0.057).
Disclosure:
Rotar,
None;
M. Tomsic,
None.
« Back to 2013 ACR/ARHP Annual Meeting
ACR Meeting Abstracts - https://acrabstracts.org/abstract/survival-of-the-second-biologic-after-the-first-tumor-necrosis-factor-alpha-inhibitors-failure-in-the-treatment-of-rheumatoid-arthritis-prospective-observational-data-from-biorx-si-registry/


