Session Information
Session Type: ACR Poster Session C
Session Time: 9:00AM-11:00AM
Background/Purpose: Treat to target (T2T) trials in RA to
date have focused on the effect of T2T on articular disease without directly
addressing cardiovascular risk. The aim of this study was to examine if a T2T
strategy is associated with improved cardiometabolic risk factors in patients
with newly diagnosed RA.
Methods: Patients were participants in TACARRA (TArgeting
CArdiometabolic Risk in Rheumatoid Arthritis) and had RA based on 2010 ACR
criteria with symptoms <2 years, were DMARD- and biologic-naïve (except
hydroxychloroquine), took corticosteroid equivalent of prednisone ≤10 mg
daily, had clinical disease activity index (CDAI) >10 and did not have known
diabetes. The patients were treated according to a predetermined structured
protocol that mandated treatment escalation for CDAI >10. The primary outcome
was insulin resistance as assessed primarily by the homeostatic model
assessment 2 for insulin resistance (HOMA2-IR) and secondarily by the 2 hour
glucose tolerance test (GTT). Secondary outcomes were lipid levels and body
composition measurements by dual energy xray absorptiometry (Hologic).
Differences between outcome data at 52 weeks and baseline was tested using the
Wilcoxon signed rank test. Differences of the change between 52 weeks and
baseline in patients with low (CDAI ≤10) and higher (CDAI >10) disease
activity at 52 weeks were compared using exact Wilcoxon tests.
Results: Of the 25 patients who entered the study, the 16
completing 52 week follow-up were included in the analysis. 44% were female
with median age 55 years. 75% were RF and 62.5% ACPA positive respectively,
with median body mass index (BMI) 29 kg/m2. Patient characteristics
and outcome measures at baseline and week 52 are shown in Table. At week 52, 10
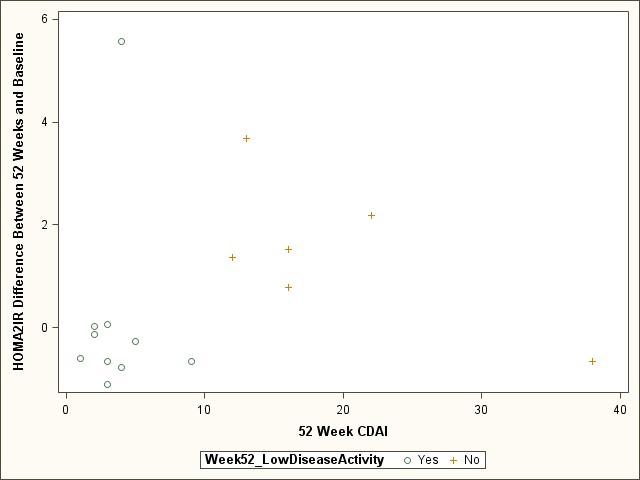
patients had low and 6 patients had higher disease activity. Median change in
HOMA2-IR levels was -0.43 (-0.65, 0.02) vs.1.45 (0.78, 2.18), p=0.06, and
median change in HDL was 2.5 (0.0, 12.0) vs. -11.5 (-19.0, -6.0), p< 0.01 in
the low and higher disease activity groups respectively. The low disease
activity patients at 52 weeks were more likely to be on hydroxychloroquine and
had a smaller increase in BMI between 52 weeks and baseline. Change in HOMA2-IR
according to disease activity at 52 weeks is shown in Figure.
Conclusion: Newly diagnosed RA patients who reach low
disease activity (CDAI ≤10) by 1 year of treatment have higher HDL and a
trend to lower insulin resistance than patients with higher disease activity.
Although our findings need confirmation in larger trials, they provide evidence
that T2T is associated with decreased cardiometabolic risk factors in RA.
|
Table. Patient characteristic of RA patients at baseline and week 52 (n=16) |
||||
|
|
Baseline |
52 Week |
Week 52 – Baseline Difference Median (IQR) |
Baseline to 52 Week Difference P-value |
|
Age, median (IQR) |
55.0 (49.5, 67.5) |
|
|
|
|
Female |
7 (43.8%) |
|
|
|
|
RF Positive |
12 (75.0%) |
|
|
|
|
CCP Positive |
10 (62.5%) |
|
|
|
|
CDAI, median (IQR) |
32.0 (22.0, 39.5) |
4.5 (3.0, 14.5) |
-25 (-31, -18) |
< 0.001 |
|
DAS28, median (IQR) |
4.6 (4.3, 5.9) |
2.2 (2.0, 3.9) |
-2.1 (-2.6, -1.2) |
< 0.001 |
|
MHAQ, median (IQR) |
5.0 (1.5, 11.0) |
0.5 (0.0, 5.5) |
-2.5 (-5.5, 0.0) |
0.006 |
|
BMI, median (IQR) |
28.8 (24.4, 35.4) |
31.4 (25.2, 38.6) |
0.8 (0.4, 2.6) |
0.006 |
|
ESR, median (IQR) |
29.0 (22.0, 48.5) |
18.0 (10.0, 29.0) |
-12.0 (-22.5, -5.5) |
< 0.001 |
|
2hour GGT mg/dL, median (IQR) |
131.0 (107.0, 153.0) |
109.0 (89.5, 136.5) |
-11.0 (-27.5, 2.0) |
0.11 |
|
HOMA2 IR, median (IQR) |
1.67 (1.55, 2.07) |
1.77 (0.92, 3.43) |
-0.06 (-0.65, 1.45) |
0.46 |
|
HDL, median (IQR) |
59.0 (48.5, 67.0) |
54.5 (43.0, 65.0) |
0.0 (-9.5, 5.0) |
0.50 |
|
LDL, median (IQR) |
88.0 (78.0, 114.5) |
89.0 (75.5, 99.0) |
-7.5 (-14.5. 7.0) |
0.21 |
|
Total Cholesterol, median (IQR) |
178.5 (156.0, 204.5) |
165.0 (149.5, 177.0) |
-0.5 (-29.5, 10.5) |
0.40 |
|
Triglycerides, median (IQR) |
101.0 (72.0, 166.0) |
109.0 (87.5, 130.0) |
-16.5 (-30.5, 25.5) |
0.64 |
|
Total Body % Fat, median (IQR)* |
35.7 (31.2, 48.5) |
36.1 (32.7, 48.9) |
0.4 (-1.0, 2.4) |
0.14 |
|
Total Lean Mass in the Limbs, median (IQR) * |
23,234 (18,014, 28,799) |
23,334 (19,154, 29,079) |
786 (-234, 1261) |
0.02 |
|
Trunk Fat Mass, median (IQR)* |
17,913 (9114, 24,373) |
16,880 (8574, 25,616) |
82 (-937, 2364) |
0.33 |
|
*n=15 |
||||
Figure. Change in HOMA2-IR according to RA activity at 52
weeks.
To cite this abstract in AMA style:
Bili A, Webb D, Matzko C, Berger A, Newman E, Olenginski T, Kirchner HL, Giles J, Wasko MCM. Low Disease Activity Is Associated with Higher HDL and a Trend to Lower Insulin Resistance in Rheumatoid Arthritis Patients [abstract]. Arthritis Rheumatol. 2015; 67 (suppl 10). https://acrabstracts.org/abstract/low-disease-activity-is-associated-with-higher-hdl-and-a-trend-to-lower-insulin-resistance-in-rheumatoid-arthritis-patients/. Accessed .« Back to 2015 ACR/ARHP Annual Meeting
ACR Meeting Abstracts - https://acrabstracts.org/abstract/low-disease-activity-is-associated-with-higher-hdl-and-a-trend-to-lower-insulin-resistance-in-rheumatoid-arthritis-patients/

