Session Information
Date: Tuesday, November 14, 2023
Title: (2257–2325) SLE – Diagnosis, Manifestations, & Outcomes Poster III
Session Type: Poster Session C
Session Time: 9:00AM-11:00AM
Background/Purpose: The Type 1 & 2 SLE Model encompass symptoms classically attributed to inflammation, including arthritis, rash, serositis and nephritis (Type 1 SLE), and symptoms of fatigue, widespread pain, mood disturbance, and cognitive dysfunction (Type 2 SLE). Our preliminary data suggest there are at least two distinct sub-types of Type 2 SLE, one that is related to active inflammation and another that exists regardless of inflammation. The objective of this study was to use longitudinal measures of Type 1 and Type 2 SLE activity to identify distinct subgroups of Type 2 SLE.
Methods: SLE patients meeting SLICC criteria with ≥2 visits at a university rheumatology clinic over a 36-month period between February 2018 and August 2022 were included. At each visit, rheumatologists scored Type 1 and 2 SLE activity separately by Physician’s Global Assessments, visual analog scales of 0-3 (0=no activity, 3=severe activity). Growth mixture models derived classes of patients based on their Type 1 and Type 2 PGA trajectories. We postulated quadratic trajectories and different number of classes were assessed based on objective model criteria and interpretability of the classes. Once the number of classes was selected, posterior probabilities assigned patients to the class with the highest probability. Patients were then classified according to their classes of Type 1 and Type 2 PGA trajectories into different “groups”. Differences in clinical and demographic characteristics across groups were estimated using simple statistics.
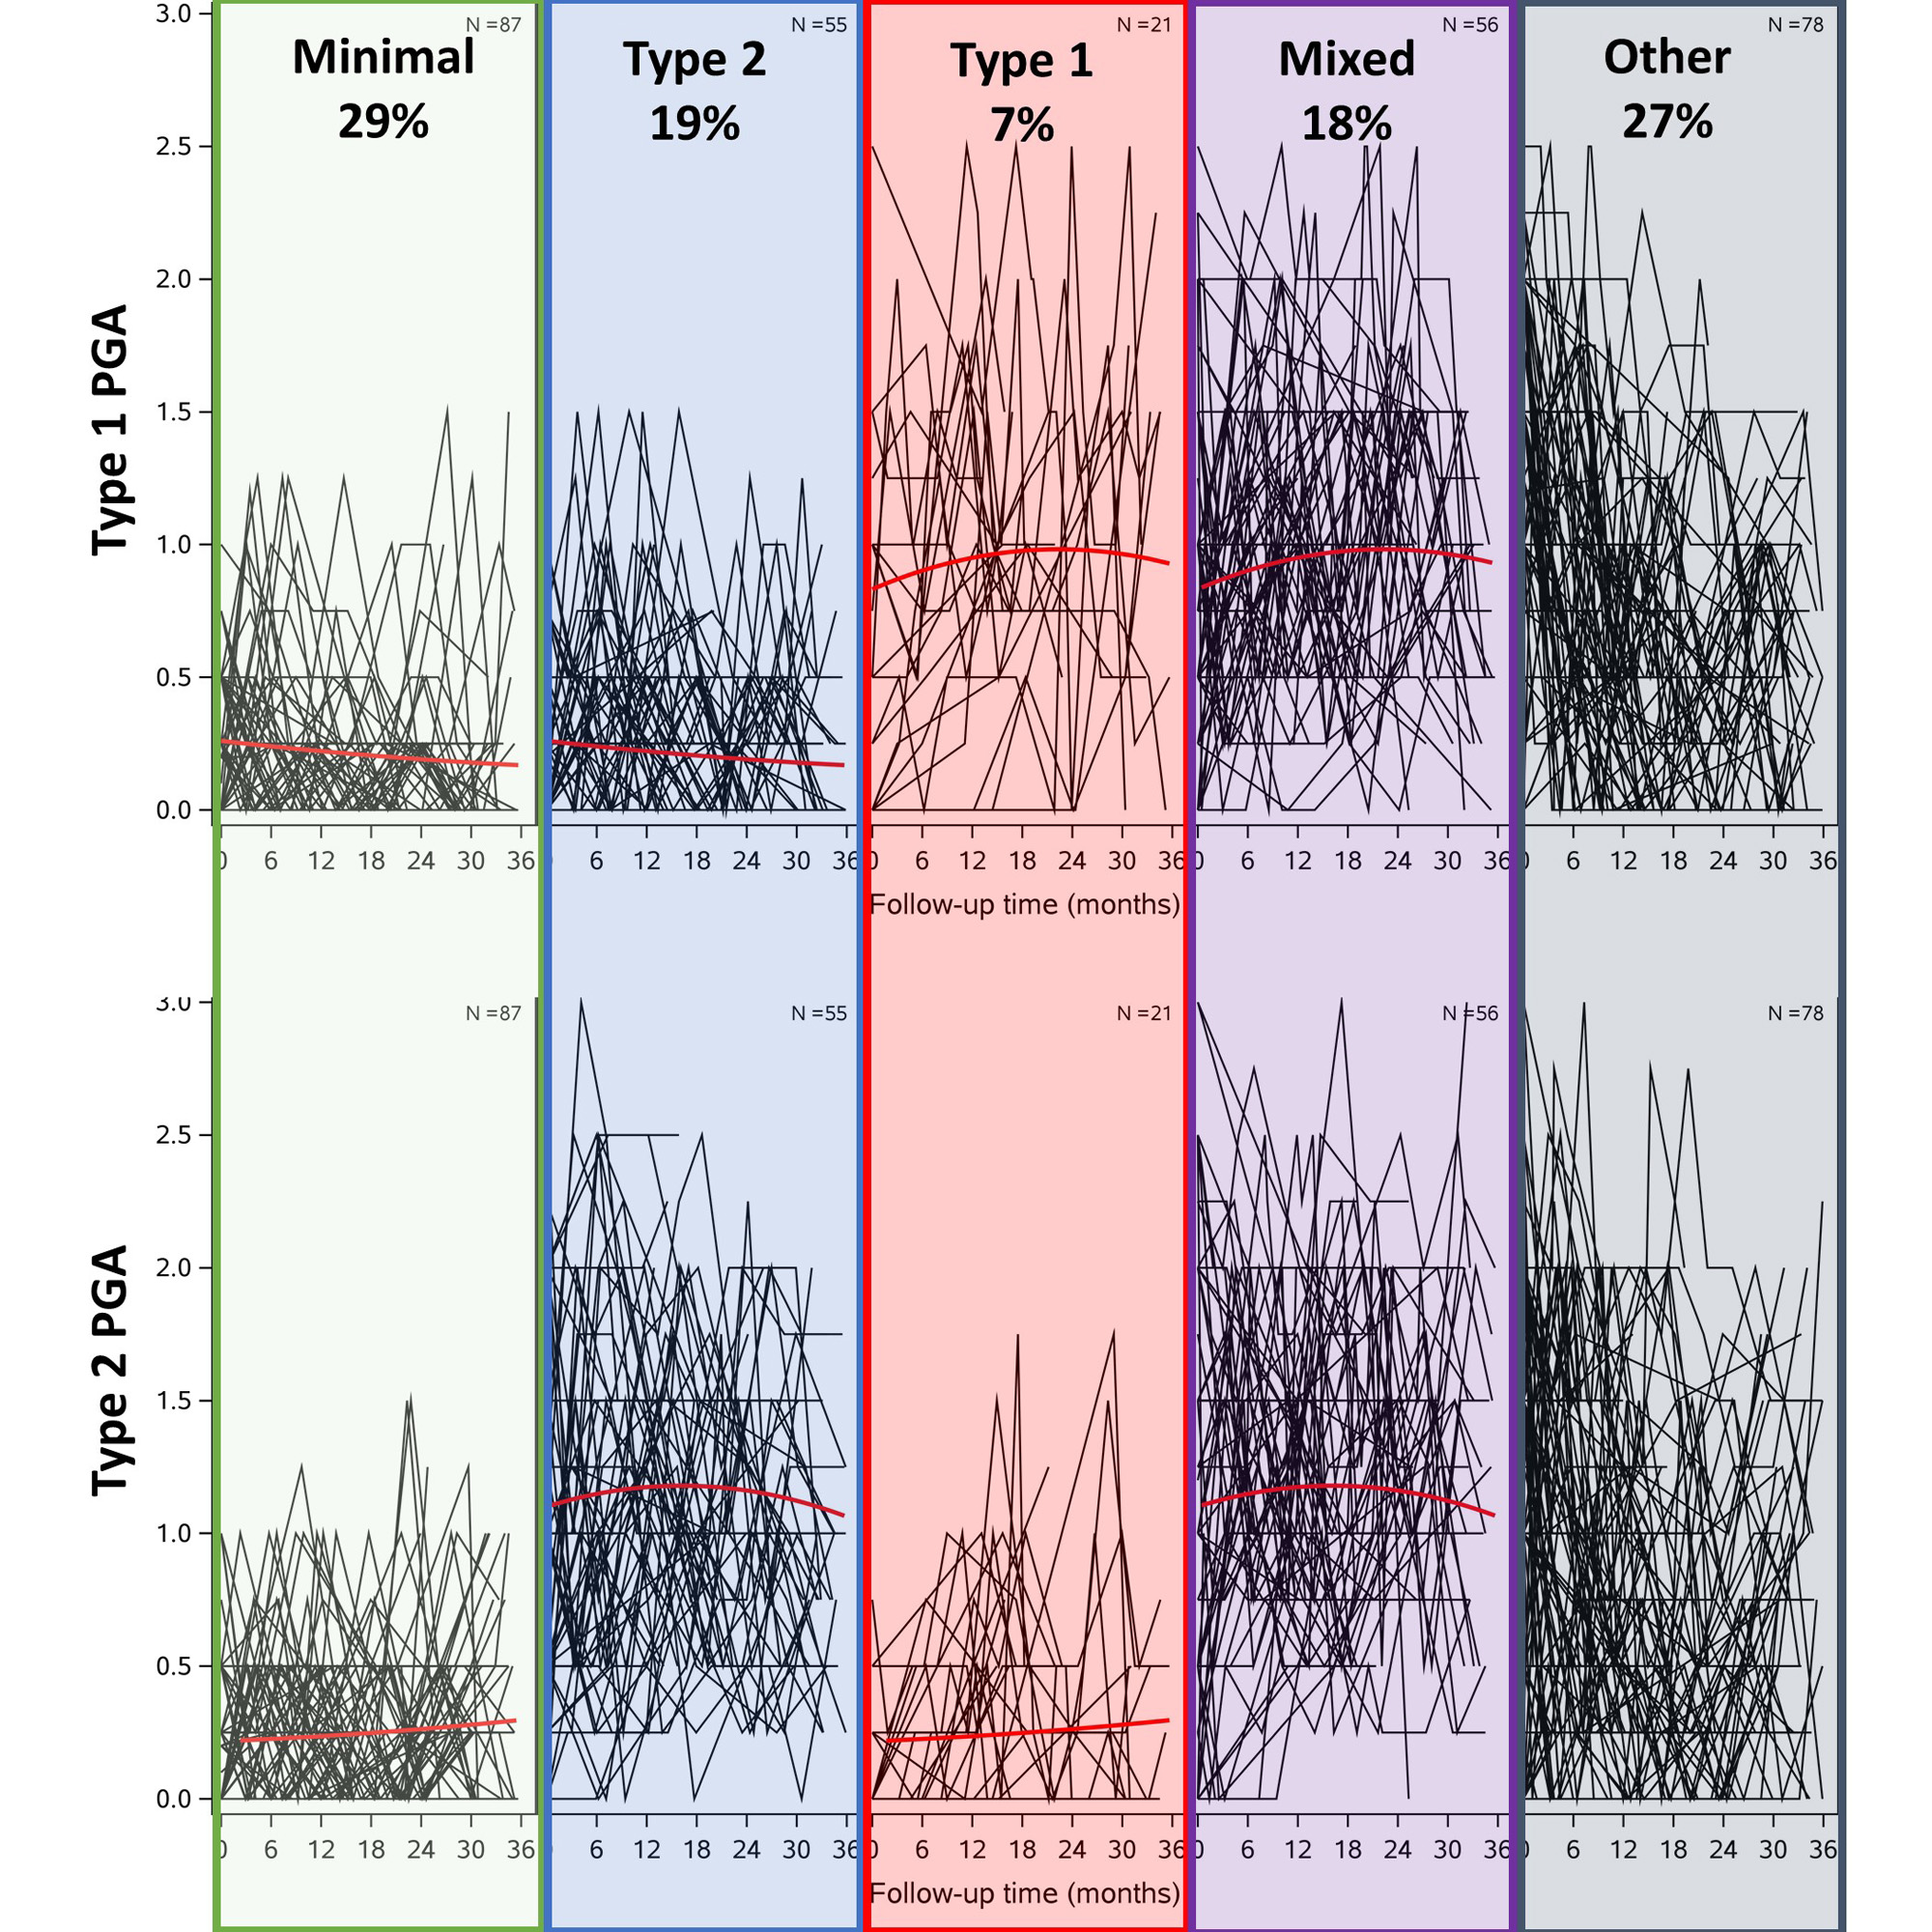
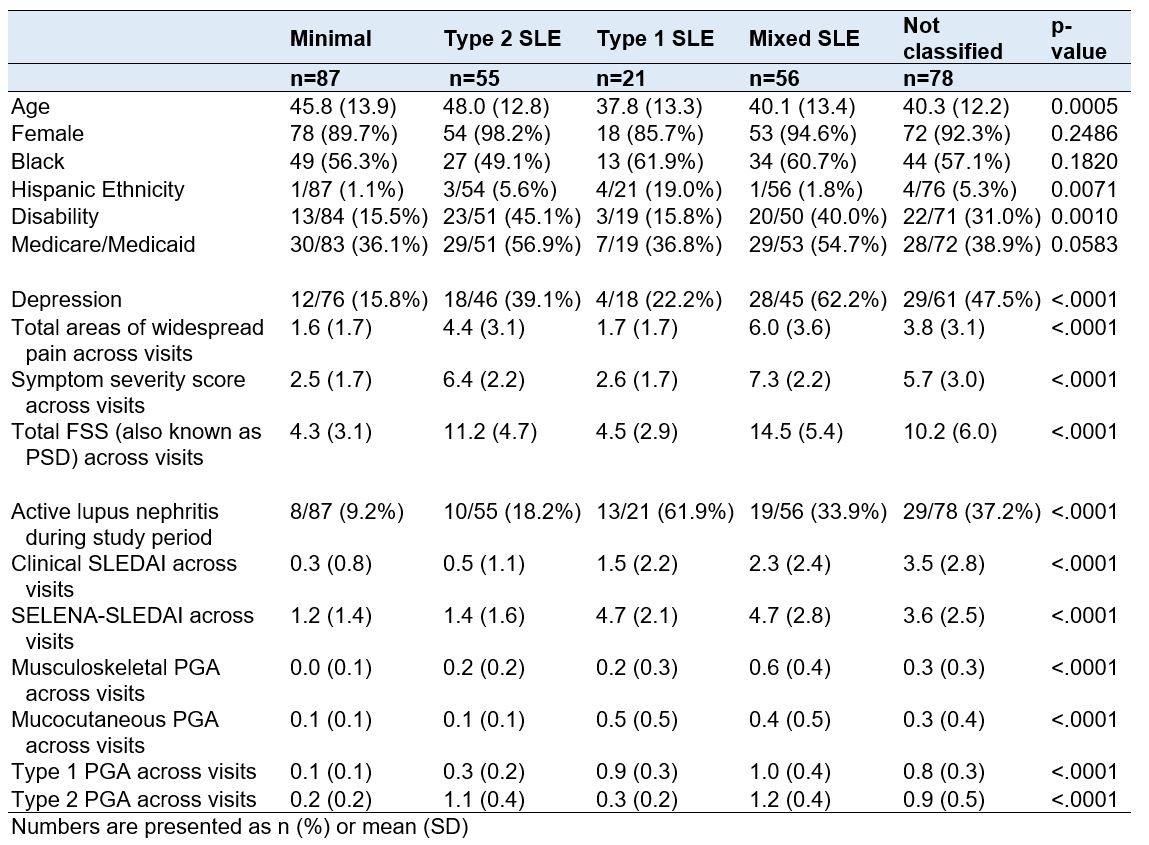
Results: We included 297 patients with 2,011 visits. The best model fit of trajectories for both the Type 1 and Type 2 PGA included three classes. When patients were grouped according to their Type 1 and Type 2 PGA classes, the majority (73%) fell into one of four groups (Figure 1): 29% had low Type 1 and Type 2 activity (Minimal); 19% had constant high Type 2 but low Type 1 activity (Type 2); 7% had constant high Type 1 but low Type 2 activity (Type 1); and 18% had constant high Type 1 and Type 2 activity (Mixed). The remaining 27% of patients had variable Type 1 and Type 2 changes over time that did not fit into a distinct group. Patients in the Type 2 SLE group were older and more likely to be on disability (Table 1). While the SLEDAI and Type 1 PGA scores were similar between the Type 1 and Mixed groups, the disease manifestations were somewhat different, with more nephritis in the Type 1 group and higher LFA-REAL Musculoskeletal PGA scores in the Mixed group. While overall Type 2 PGA scores were similar for those in the Type 2 and Mixed groups, there was more depression, pain, and symptom severity among those in the Mixed group. In a descriptive analysis to determine if Type 1 and Type 2 PGA changed concordantly, 39% of patients had Type 1 and Type 2 SLE PGAs that consistently changed together.
Conclusion: We identified 4 main longitudinal subgroups of patient trajectories. Supporting our prior qualitative work, we found changes in Type 1 and Type 2 occurred together in almost 40% of patients. Future work is needed to understand the underlying etiology of each subgroup, allowing us to target these groups with appropriate medical and non-medical treatment plans.
To cite this abstract in AMA style:
Eudy A, Rogers J, Wojdyla D, Sun K, Sadun R, Maheswaranathan M, Doss J, Criscione-Schreiber L, Clowse M. Longitudinal Changes in Type 1 & Type 2 SLE Activity [abstract]. Arthritis Rheumatol. 2023; 75 (suppl 9). https://acrabstracts.org/abstract/longitudinal-changes-in-type-1-type-2-sle-activity/. Accessed .« Back to ACR Convergence 2023
ACR Meeting Abstracts - https://acrabstracts.org/abstract/longitudinal-changes-in-type-1-type-2-sle-activity/


