Session Information
Session Type: Abstract Session
Session Time: 3:00PM-4:30PM
Background/Purpose: Uveitis occurs more frequently in patients (pts) with psoriatic disease than in the general population,1-2 yet little is known about the increased burden associated with uveitis in this population. This study evaluated healthcare resource utilization and costs associated with uveitis among pts with psoriasis (PsO) and/or psoriatic arthritis (PsA) in the United States.
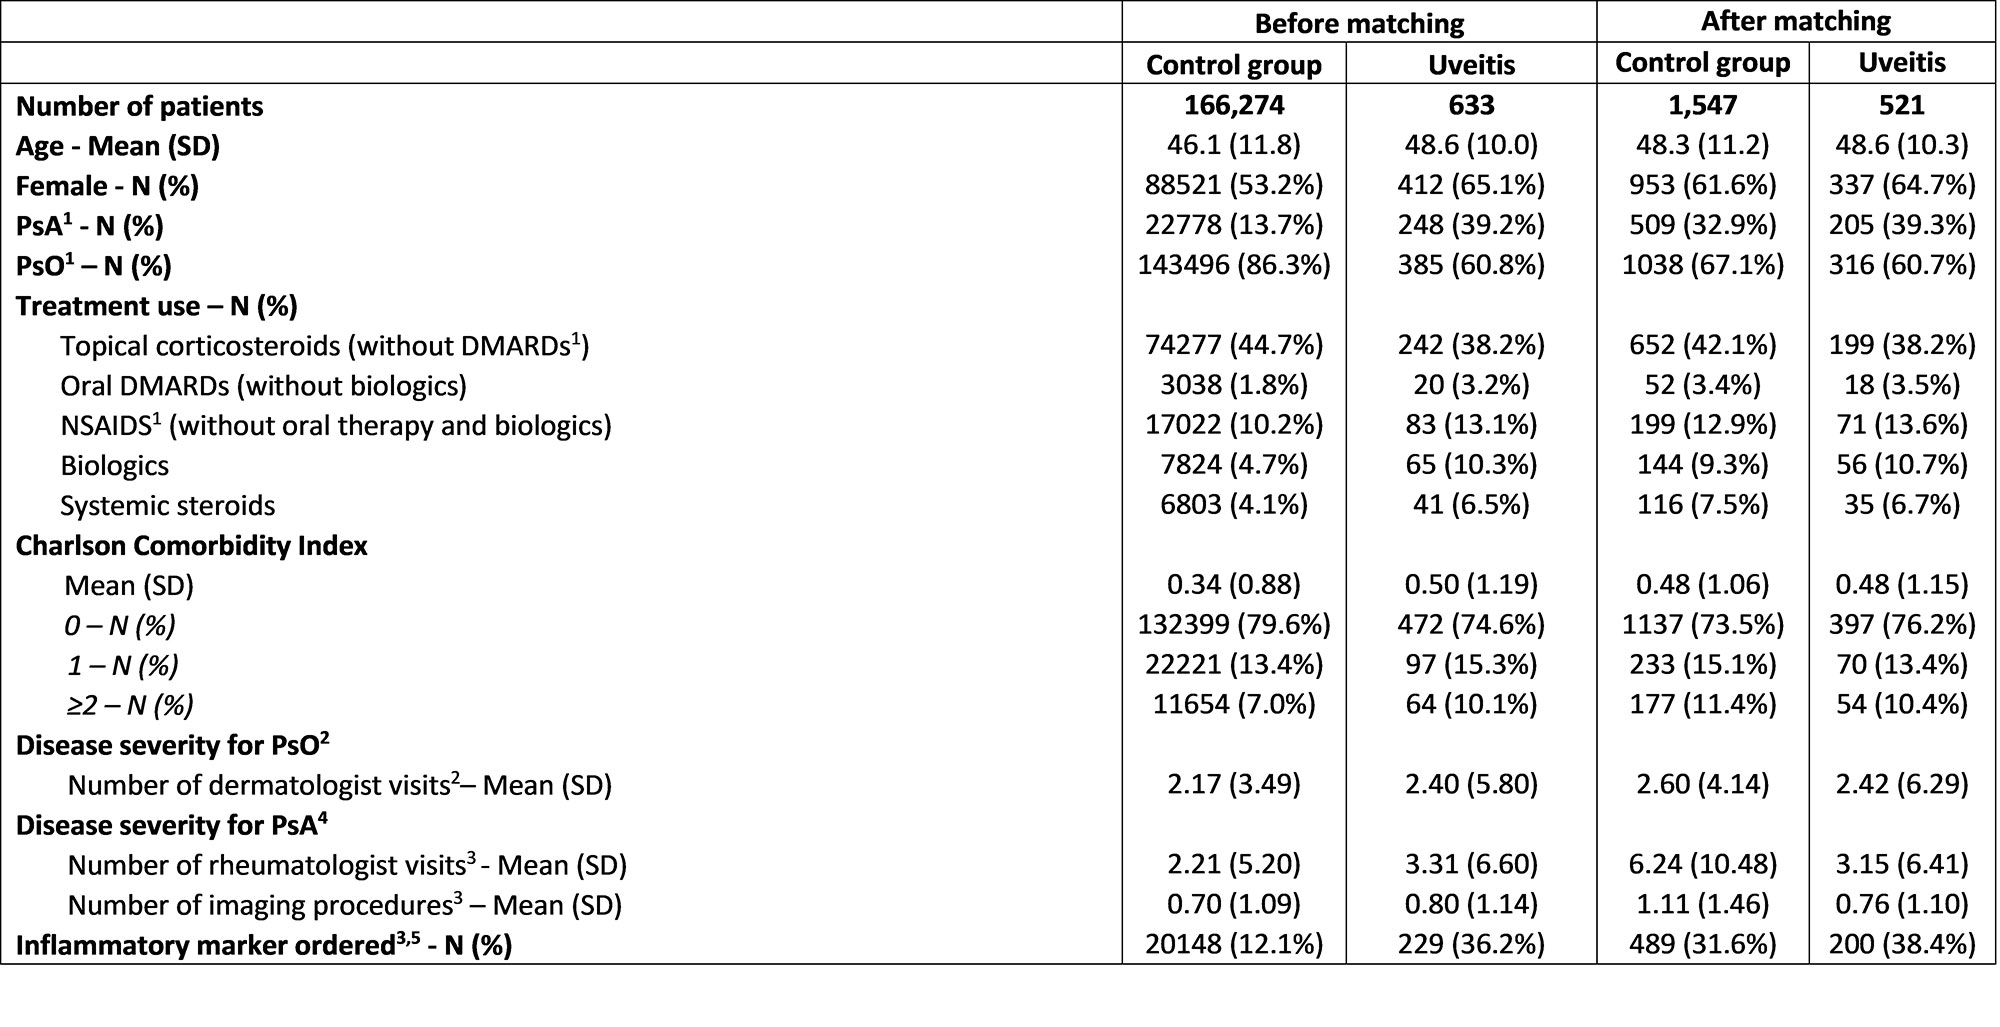
Methods: Adult pts with PsA and/or PsO were identified in the IBM® MarketScan® Commercial Database between January 2009 and January 2022; Pts with ≥ 2 diagnosis codes for PsA or ≥ 2 diagnosis codes for PsO ≥ 30 days apart with continuous enrolment from ≥ 6 months before initial PsA or PsO diagnosis (baseline period) to ≥12 months after the index date (follow-up period) were included. Pts with uveitis (i.e., cases) had ≥ 2 uveitis diagnoses < = 6 months before or any time after initial PsO/PsA diagnosis. A sensitivity analysis requiring at least 1 uveitis diagnoses by an ophthalmologist was also conducted. The index date for cases was the date of the first uveitis diagnosis. The index date for PsA/PsO pts without uveitis (controls) was defined using the cases’ median time from initial PsA or PsO diagnosis to first uveitis diagnosis. Controls were matched 3:1 to cases based on propensity scores that balanced age, gender, PsA vs. PsO diagnosis, year of initial PsO/PsA diagnosis, baseline PsO/PsA-related prescriptions, the Charlson Comorbidity Index, and variables associated with PsO/PsA disease severity (Table 1). Healthcare resource utilization and outpatient costs (in 2020 USD) were compared between cases and controls.
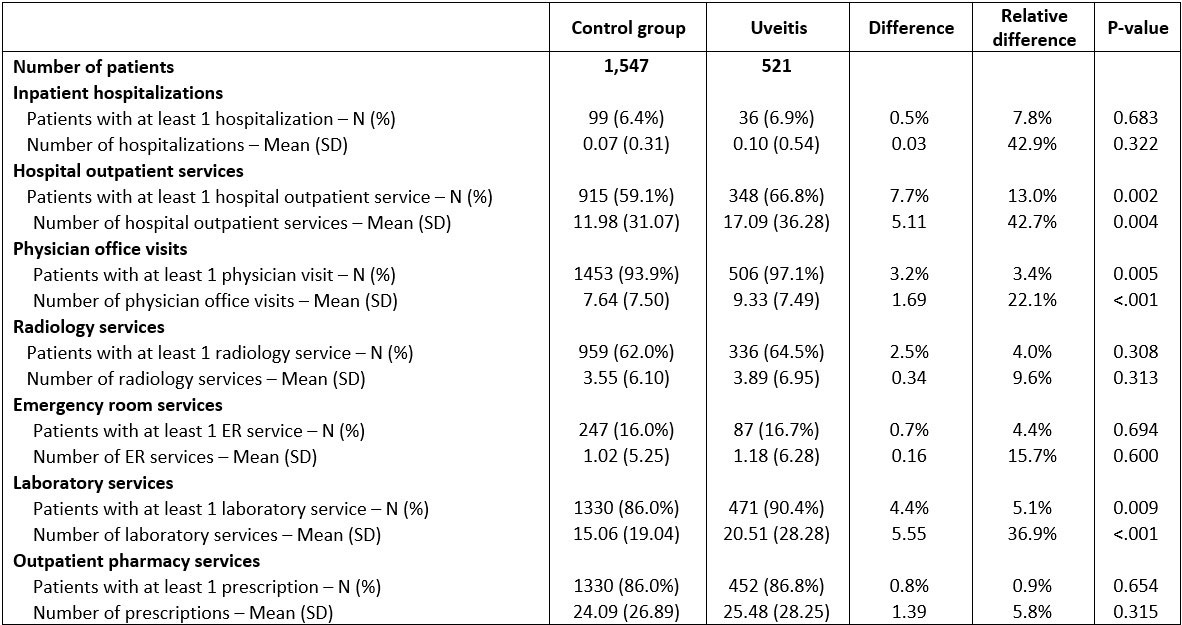
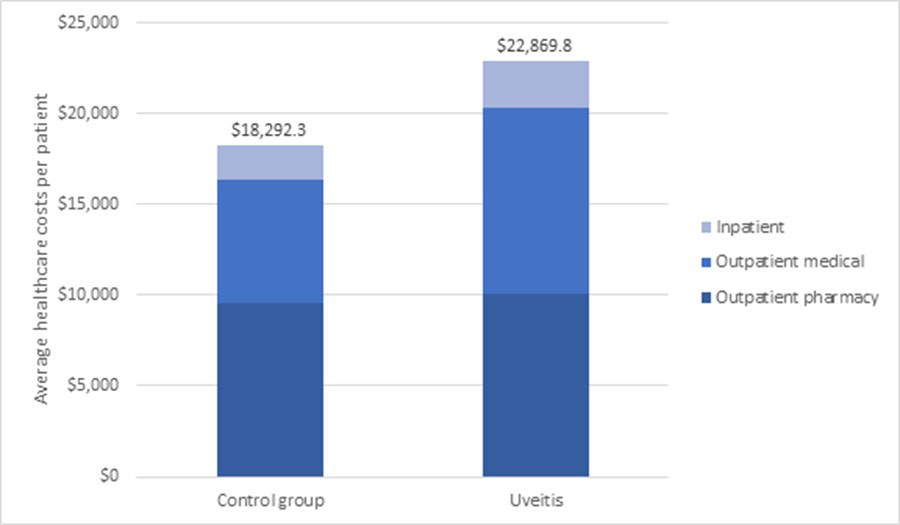
Results: 521 pts with uveitis were matched to 1,547 pts controls (Table 1). Average baseline age was 48 years; 65% of cases and 62% controls were female. Mean annual all-cause healthcare costs per pt per year (from index date) were greater among pts with uveitis ($22,870 vs. $18,292, relative difference (rd): 25%), due to significantly greater outpatient costs ($10,206 vs. $6,834, rd: 49.4%) (Figure 1) partly from greater utilization of outpatient services, laboratory services and physician office visits (all P < 0.05) (Table 2). Similar results were seen in a sensitivity analysis requiring at least 1 uveitis diagnosis by an ophthalmologist.
Conclusion: The economic burden of uveitis in PsO and/or PsA pts may be underestimated in the current investigation, as resource use covered by vision insurance is not included in the MarketScan database. Despite this limitation, this study demonstrated that PsO and/or PsA pts with uveitis incurred significantly greater healthcare costs and resource utilization than those without uveitis. Effective and timely treatments that reduce uveitis among pts with PsO and/or PsA may improve pt outcomes and decrease healthcare costs.
References
1. Joltikov, K. A., & Lobo-Chan, A. M. (2021). Epidemiology and Risk Factors in Non-infectious Uveitis: A Systematic Review. Frontiers in Medicine, 1541.
2. Lam, M., Steen, J., Lu, J. D., & Vender, R. (2020). The incidence and prevalence of uveitis in psoriasis: a systematic review and meta-analysis. Journal of Cutaneous Medicine and Surgery, 24(6), 601-607.
3. Fotiadou, C., & Lazaridou, E. (2019). Psoriasis and uveitis: links and risks. Psoriasis (Auckland, N.Z.), 9, 91–96.
1PsA = Psoriatic arthritis, PsO = Psoriasis, DMARDs = Disease-modifying antirheumatic drugs, NSAIDS = non-steroidal anti-inflammatory drugs
2Variable evaluated only in patients with PsO (143,496 controls; 385 cases before matching, and 1,038 controls; 316 cases after matching)
3Variables were evaluated during the 6-month baseline period
4Variable evaluated only in patients with PsA or with both PsA and PsO (22,778 controls; 248 cases before matching, and 509 controls; 205 cases after matching)
5Includes rheumatoid factor, erythrocyte sedimentation rate, and C-reactive protein
1Resource utilization was measured from the uveitis index date to one year of follow-up.
1Healthcare costs are expressed per patient per year
To cite this abstract in AMA style:
Husni M, Thorne J, Peterson S, Shiff N, Neff-Baro S, Lin I, Teneralli R, Adejoro O, Merola J. Increased Economic Burden of Uveitis Among Patients with Psoriasis and Psoriatic Arthritis – a Retrospective Study Using Claims Data, 2009-2022 [abstract]. Arthritis Rheumatol. 2022; 74 (suppl 9). https://acrabstracts.org/abstract/increased-economic-burden-of-uveitis-among-patients-with-psoriasis-and-psoriatic-arthritis-a-retrospective-study-using-claims-data-2009-2022/. Accessed .« Back to ACR Convergence 2022
ACR Meeting Abstracts - https://acrabstracts.org/abstract/increased-economic-burden-of-uveitis-among-patients-with-psoriasis-and-psoriatic-arthritis-a-retrospective-study-using-claims-data-2009-2022/


