Session Information
Session Type: Poster Session (Monday)
Session Time: 9:00AM-11:00AM
Background/Purpose: Earlier diagnosis and less toxic immunosuppressive therapies have improved the survival of patients with vasculitis. Current data on mortality rates of vasculitis are limited. We aimed to estimate the mortality rates of primary vasculitis using the most recent publicly available mortality data in the United States.
Methods: We used the CDC Wonder Underlying Cause of Death database and its query system to obtain mortality rates of vasculitis as the underlying cause of death from 1999 to 2017. We used the following ICD-10 codes: D69.0 (Allergic purpura) for Henoch-Schoenlein purpura, D89.1 (Cryoglobulinaemia) for cryoglobulinemia, M30.0 (Polyarteritis nodosa) for polyarteritis nodosa (PAN), M30.1 (Polyarteritis with lung involvement [Churg-Strauss]) for eosinophilic granulomatosis with polyangiitis (EGPA), M30.2 (Juvenile polyarteritis) for juvenile polyarteritis, M30.3 (Mucocutaneous lymph node syndrome [Kawasaki]) for Kawasaki’s disease, M30.8 (Other conditions related to PAN), M31.0 (Hypersensitivity angiitis) for Goodpasture’s syndrome, M31.3 (Wegener’s granulomatosis) for granulomatosis with polyangiitis (GPA), M31.4 (Aortic arch syndrome [Takayasu]) for Takayasu’s arteritis (TAK), M31.5 (Giant cell arteritis [GCA] with polymyalgia rheumatica [PMR]) for GCA with PMR, and M31.6 (Other GCA) for GCA, M31.7 (Microscopic polyangiitis [MPA]), and M35.2 (Behcet’s disease). Mortality rates were obtained by year, gender, race, state and separately for the specific ICD codes. To obtain age-adjusted mortality rates we used year 2000 U.S. standard population. Mortality rates are given as number of deaths per million. A linear regression model was applied to evaluate trends over time.
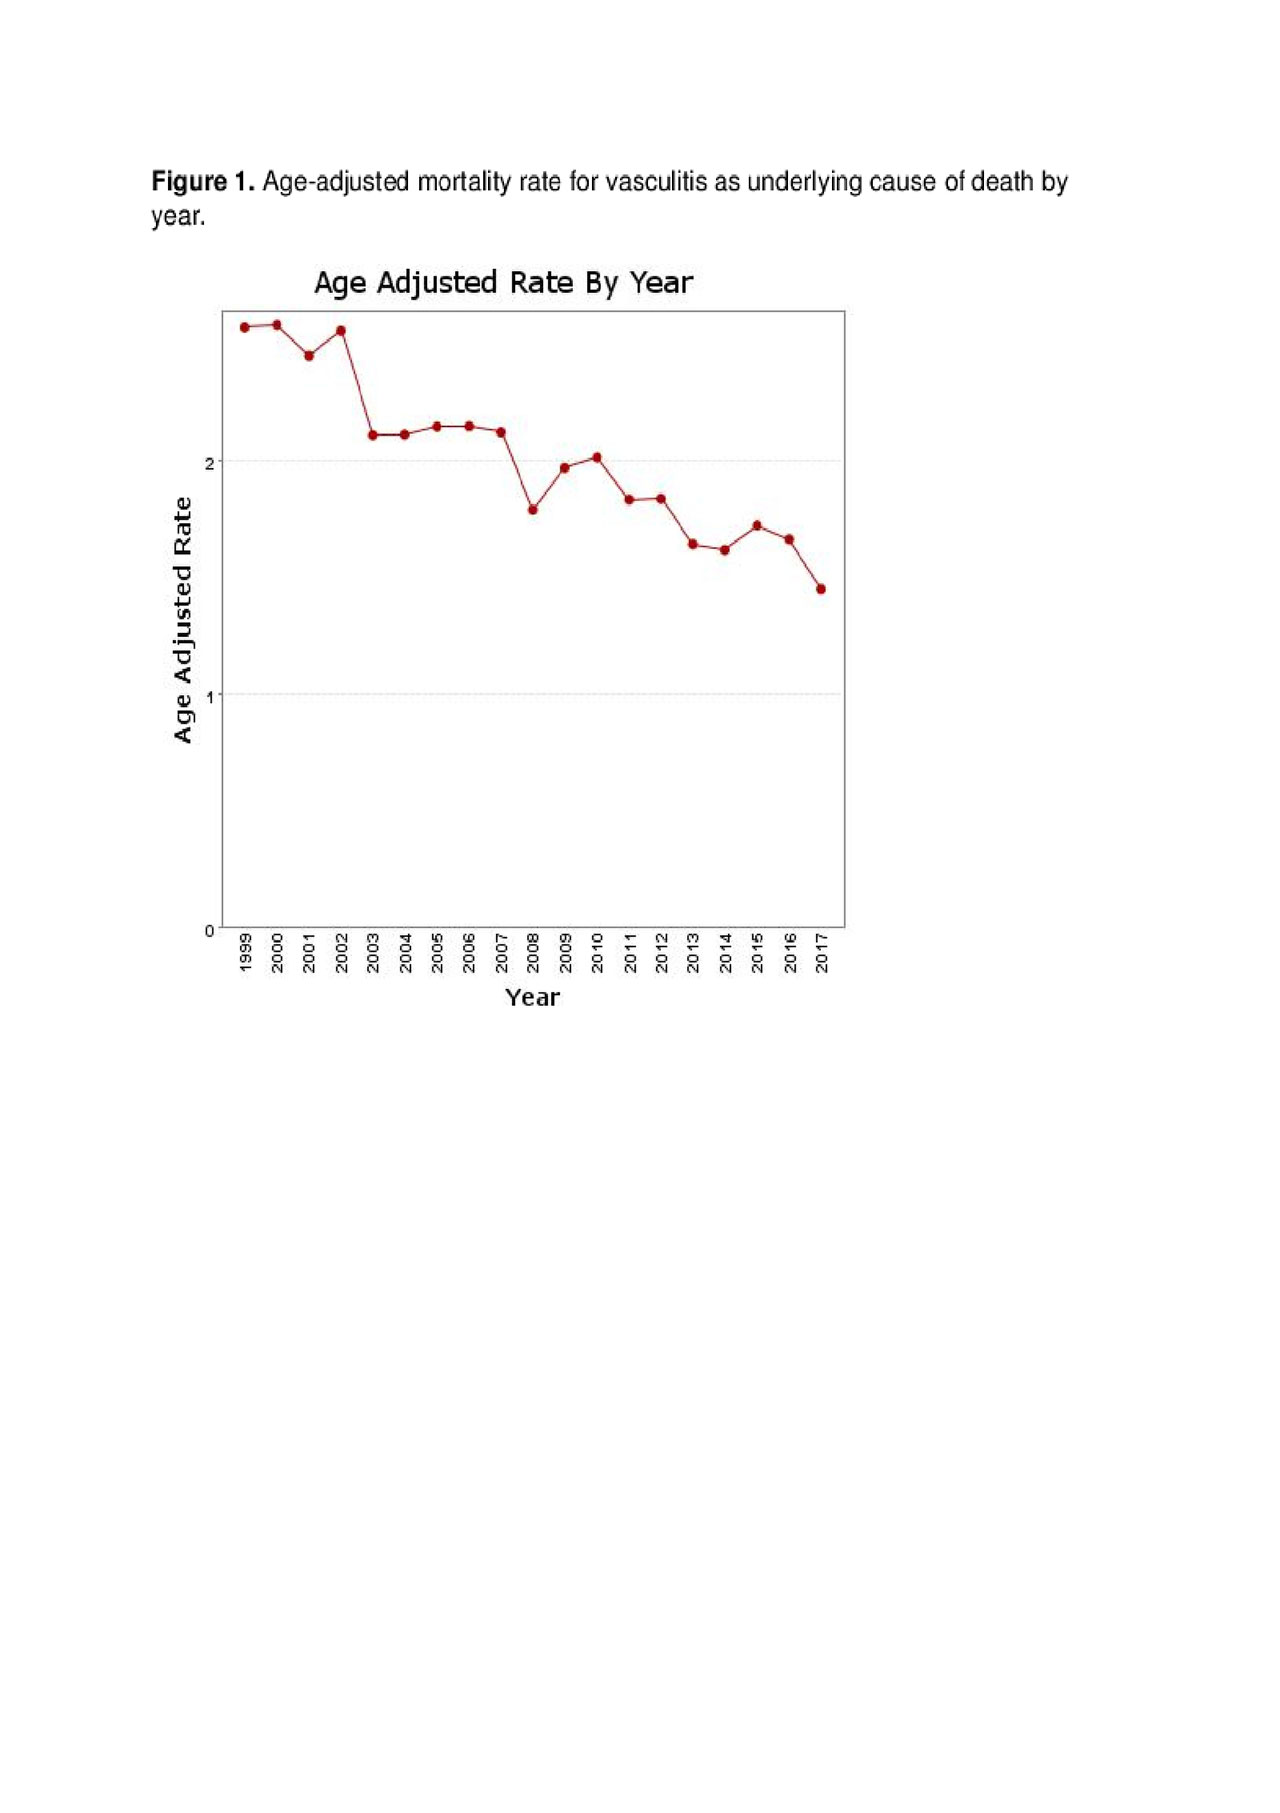
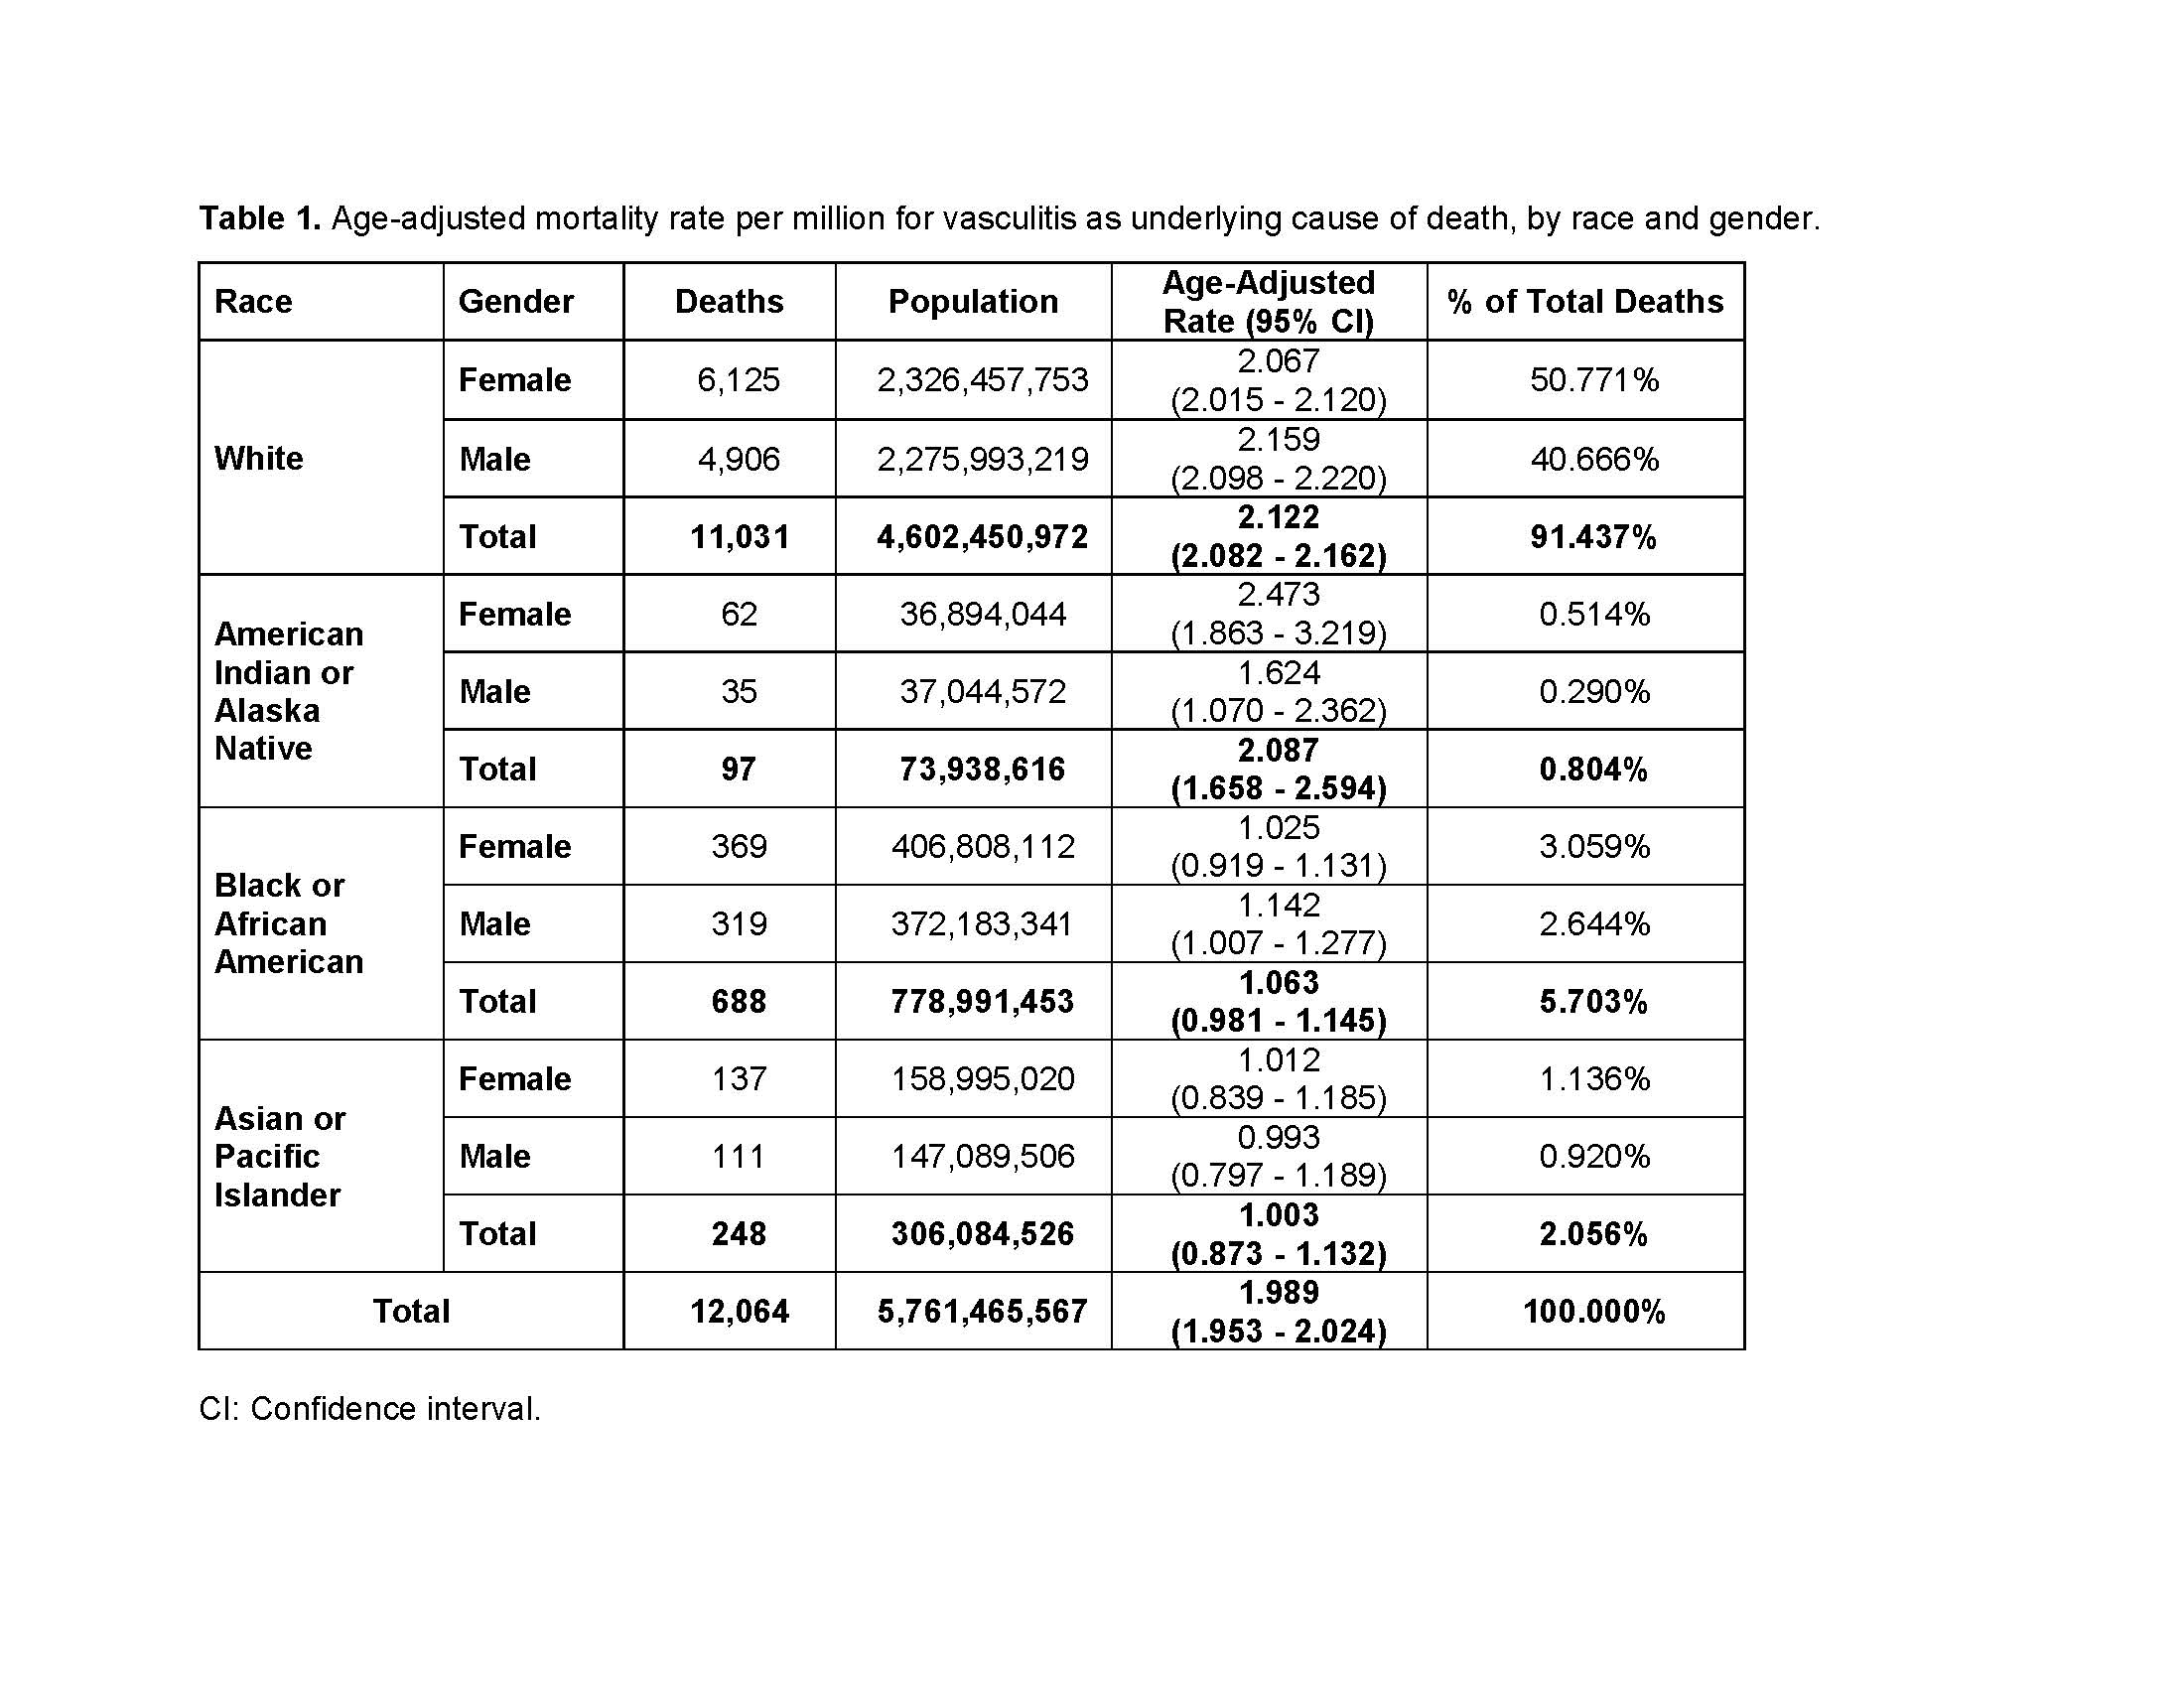
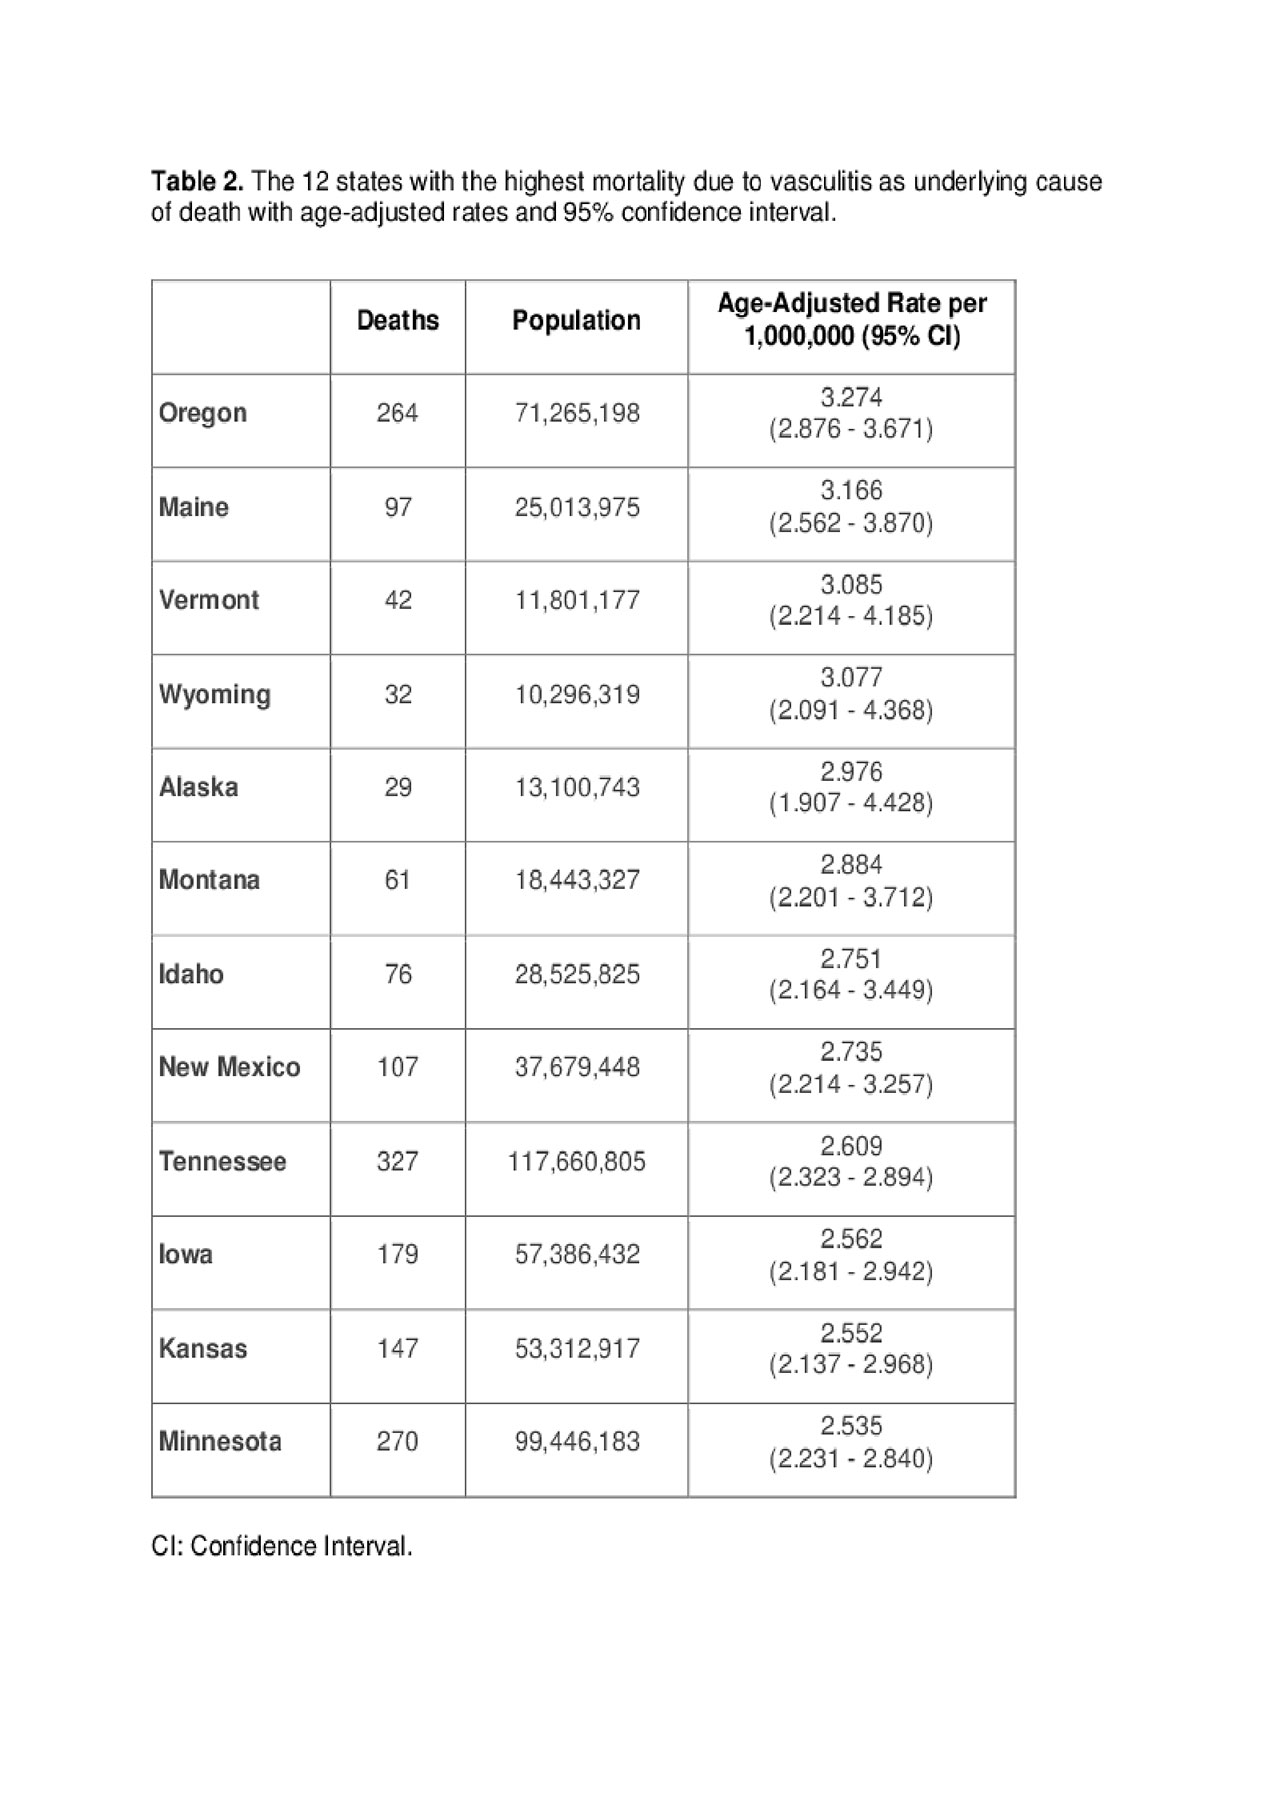
Results: During the 19-year period, vasculitis was the underlying cause of death of 12,064 patients. Age-adjusted mortality rate was 1.99 per million (95% CI: 1.95-2.02). Since 1999, there has been a significant trend to the decrease (p< 0.0001) (Figure 1). The age-adjusted mortality rate was higher in males than in males (2.05 vs. 1.94 per million). Age-adjusted mortality rate was higher in Whites (2.12, 2.08-2.16) than in Blacks (1.06, 0.98-1.14) (Table 1). GPA accounted for 50.93% of all vasculitis deaths. Interestingly, there was only one death for GCA with PMR and only one for juvenile polyarteritis. There was geographic distribution in the mortality rates of vasculitis by estates. The estates with the highest age-adjusted mortality rates were Oregon, Maine, Vermont, Wyoming and Alaska (Table 2). The estates with the lowest rates were New York, North Dakota, Hawaii, New Jersey and Rhode Island. and.
Conclusion: Mortality by vasculitis remains very low, probably due to the low incidence of these disorders. There is a progressive decrease of the mortality rates. Age-adjusted mortality rate was higher in males and in Whites, which can be explained by the fact that GPA, which is more frequent in males and Whites, is responsible for half of the overall number of deaths. Investigation of the reasons for the geographic disparities is warranted. Our findings should be taken with caution until quality studies to determine the reliability of the data about these rare diseases available in national databases are performed.

Figure 1_Mortality in Vasculitis_ACR 2019 Abstract

Table 1_Mortality in Vasculitis_ACR 2019 Abstract

Table 2_Mortality in Vasculitis_ACR 2019_Abstract
To cite this abstract in AMA style:
Rodriguez-Pla A. Geographic Disparities in Mortality Rates of Vasculitis in the United States: 1999 to 2017 [abstract]. Arthritis Rheumatol. 2019; 71 (suppl 10). https://acrabstracts.org/abstract/geographic-disparities-in-mortality-rates-of-vasculitis-in-the-united-states-1999-to-2017/. Accessed .« Back to 2019 ACR/ARP Annual Meeting
ACR Meeting Abstracts - https://acrabstracts.org/abstract/geographic-disparities-in-mortality-rates-of-vasculitis-in-the-united-states-1999-to-2017/
