Session Information
Date: Wednesday, November 13, 2019
Title: 6W013: SLE – Clinical VI: Epidemiology, Diagnosis, & Outcomes (2882–2887)
Session Type: ACR Abstract Session
Session Time: 9:00AM-10:30AM
Background/Purpose: Fatigue is very common in SLE patients. We aim to: 1) determine if different trajectories of fatigue associate with specific latent classes of disease activity and 2) define the patient characteristics and associated factors in different latent classes.
Methods: This is a retrospective analysis on a prospectively collected dataset from an inception cohort and followed from 1997 to 2018. Fatigue levels was measured using Fatigue Severity Scale (FSS- scores range from 1-7, higher scores reflect more fatigue) and disease activity using the adjusted mean SLEDAI-2K (AMS). Ten-year cumulative SLE organ involvement were ascertained by SLEDAI-2K organ system. Joint latent class trajectory analysis for fatigue and AMS was performed using a group-based trajectory model in SAS PROC TRAJ. Each trajectory was fitted for the FSS and AMS. Models with the lowest Bayesian Information Criterion and groups containing > 9% of the total sample size were selected as the final models. Univariate and multivariate ordinal logistic regression analyses, using baseline variables, were performed to determine the predictors of both worse fatigue and AMS scores. This was performed on members with both latent class posterior probability ≥ 0.80.
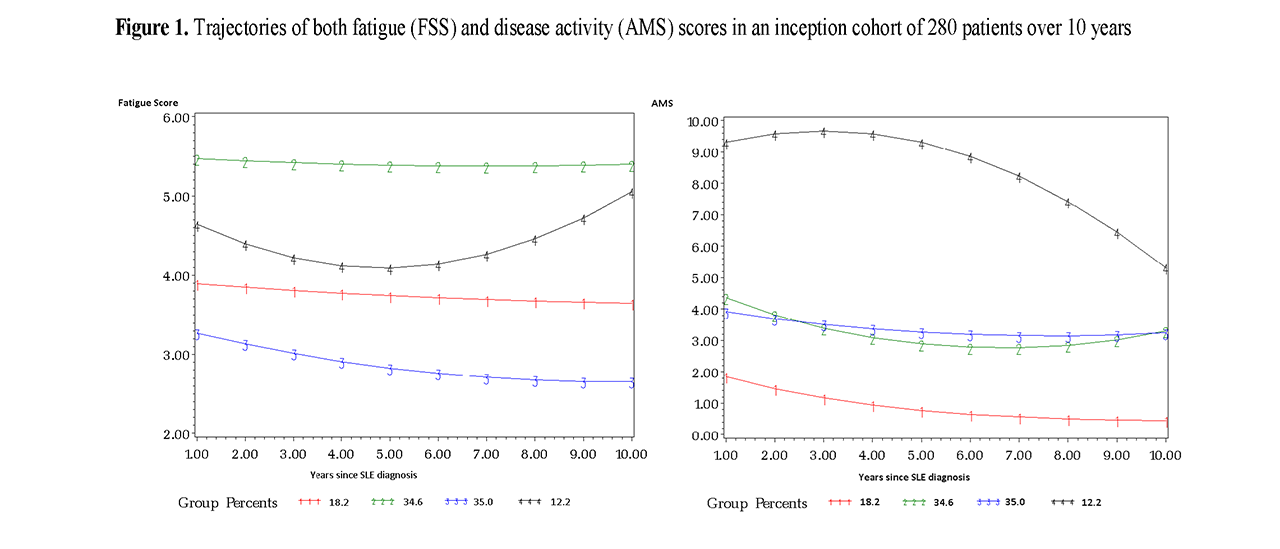
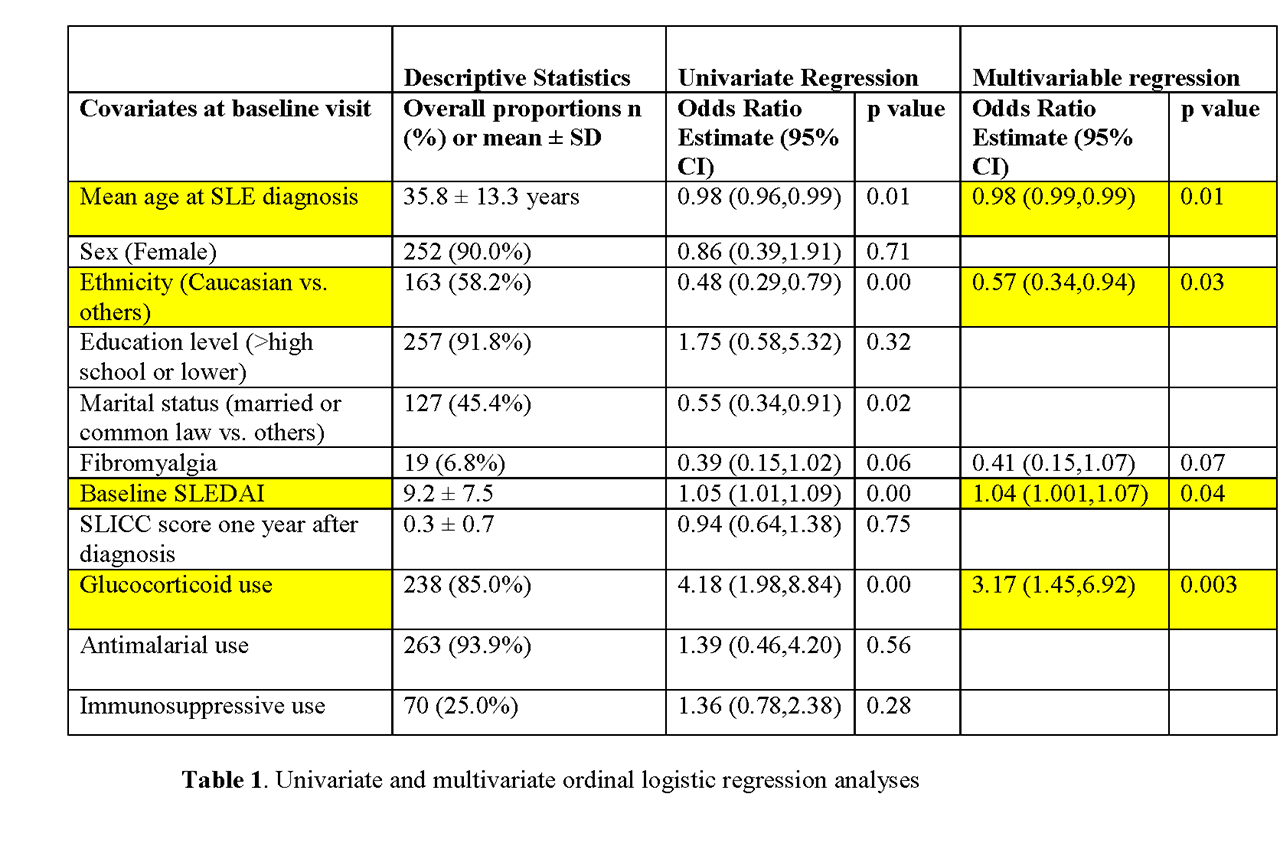
Results: Among 280 inception patients with mean age of 35.8± 13.3 years, 4 latent classes (C) were created (figure 1): C1- very low disease activity and low fatigue (18.2%); C2 second lowest disease activity and highest fatigue trajectory (34.6%); C3 median disease activity and the lowest fatigue trajectory (35.0%); and C4 high disease activity and high fatigue trajectory (12.2%). C2 and C3 had similar AMS scores over time but different fatigue trajectories. C2 (highest fatigue) and C4 (high fatigue) had the highest proportion of individuals living with fibromyalgia (34.1% vs. 14.0% respectively) and cumulative glucocorticoid use at 10 years (37.2 ±15.7 grams vs. 44.4 ± 19.7 grams). SDI was highest in C4 (second lowest disease activity, highest fatigue score) with 67% of individuals having SDI >0. SDI was lowest in C3 (median disease activity, low fatigue score) with 53.2% of individuals having SDI >0. Cumulative organ involvement over 10 years showed that C4 included the most amount of individuals with central nervous system (43.8%), vasculitis (43.8%), renal (68.8), skin (100%), serosal (18.8%), immunologic (100%), and hematological (50%) manifestations; C2 had the most musculoskeletal findings (72.9%). Regression analyses showed that age at SLE diagnosis (OR: 0.98, 95% CI: 0.96; 0.99), Caucasian (OR 0.57, 95% CI: 0.34; 0.94), SLEDAI-2K scores (1.04, 95% CI: 1.00; 1.07) and glucocorticoid use (OR 3.2, 95% CI: 1.4; 6.9) were significantly associated with fatigue trajectories (Table 1).
Conclusion: There are 4 distinct joint classes of fatigue and disease activity trajectories. Disease activity alone cannot fully explain fatigue trajectories over time. Trajectories with higher FSS and AMS scores, classes C2 and C4, are associated with more fibromyalgia and cumulative glucocorticoid use. Baseline SLEDAI-2K scores were more likely associated with worse trajectories of fatigue, being a Caucasian and older age at SLE diagnosis were associated with better fatigue trajectories.
To cite this abstract in AMA style:
Moazzami M, Strand V, Su J, Touma Z. Combined Trajectories of Fatigue and Disease Activity in an Inception Cohort of Lupus Patients over 10 Years [abstract]. Arthritis Rheumatol. 2019; 71 (suppl 10). https://acrabstracts.org/abstract/combined-trajectories-of-fatigue-and-disease-activity-in-an-inception-cohort-of-lupus-patients-over-10-years/. Accessed .« Back to 2019 ACR/ARP Annual Meeting
ACR Meeting Abstracts - https://acrabstracts.org/abstract/combined-trajectories-of-fatigue-and-disease-activity-in-an-inception-cohort-of-lupus-patients-over-10-years/


