Session Information
Session Time: 6:00PM-7:00PM
Background/Purpose: The interplay between body mass index (BMI) and disease outcomes in childhood-onset systemic lupus erythematosus (cSLE) has not been characterized. Neighborhood factors drive health disparities and may affect both BMI trajectories and cSLE outcomes. We examined associations of area-level factors captured by the Child Opportunity Index (COI) with BMI changes over time and subsequent cSLE outcomes.
Methods: BMI trajectories of children with incident cSLE followed for ≥1 year at a tertiary center (2000-2014 inclusive) were identified using group-based trajectory modeling. We included children with incident SLE that met criteria for at least one of 1997 ACR, SLICC, or 2019 ACR-EULAR SLE classification; 93% of them met ACR-EULAR criteria. Predictors of trajectory membership, including COI v3.0 level (very low/low, moderate/high, very high), and longitudinal outcomes, SLE disease activity index (SLEDAI-2K) and urine protein: creatinine ratio (UPC), were evaluated using multinomial logistic and mixed-effects models, respectively, adjusted for baseline factors.
Results: Among 163 children with cSLE (1,559 total visits), 46% lived in low/very low COI areas, 45% were publicly insured, 19% were Black and 21% Hispanic; most Hispanic (85%) and Black (74%) patients lived in low/very low COI areas. Overall, 12% were underweight and 26% were overweight/obese at cSLE diagnosis. Three BMI trajectory groups: “High”, “Intermediate”, and “Low” were identified (Fig. 1). Predictors of group membership are shown in Table 1. Younger age of onset and residence in moderate/high vs. very high COI areas increased the likelihood of low BMI trajectory, with a similar non-significant trend for low/very low COI. More Black and publicly insured patients tended toward the high BMI group (Table 1). SLEDAI-2K scores decreased over time across all groups, but those living in moderate/high and low/very low COI areas had higher mean SLEDAI compared to very high COI areas (Fig. 2A). This association persisted after adjustment for BMI category, although underweight status was independently associated with higher disease activity vs. normal weight (Fig. 2B). Among 72 patients with lupus nephritis, UPC decreased over time, with a trend toward higher UPC in lower COI areas (Fig. 2C). BMI category was not associated with UPC over time (Fig. 2D).
Conclusion: Lower neighborhood opportunity was associated with low BMI trajectories and higher disease activity in children with cSLE, with a trend toward greater proteinuria among those from disadvantaged areas. These findings suggest that social and environmental context may influence disease severity and recovery in cSLE and warrant validation in larger, multi-center studies.
Table 1. Predictors of BMI trajectory group membership.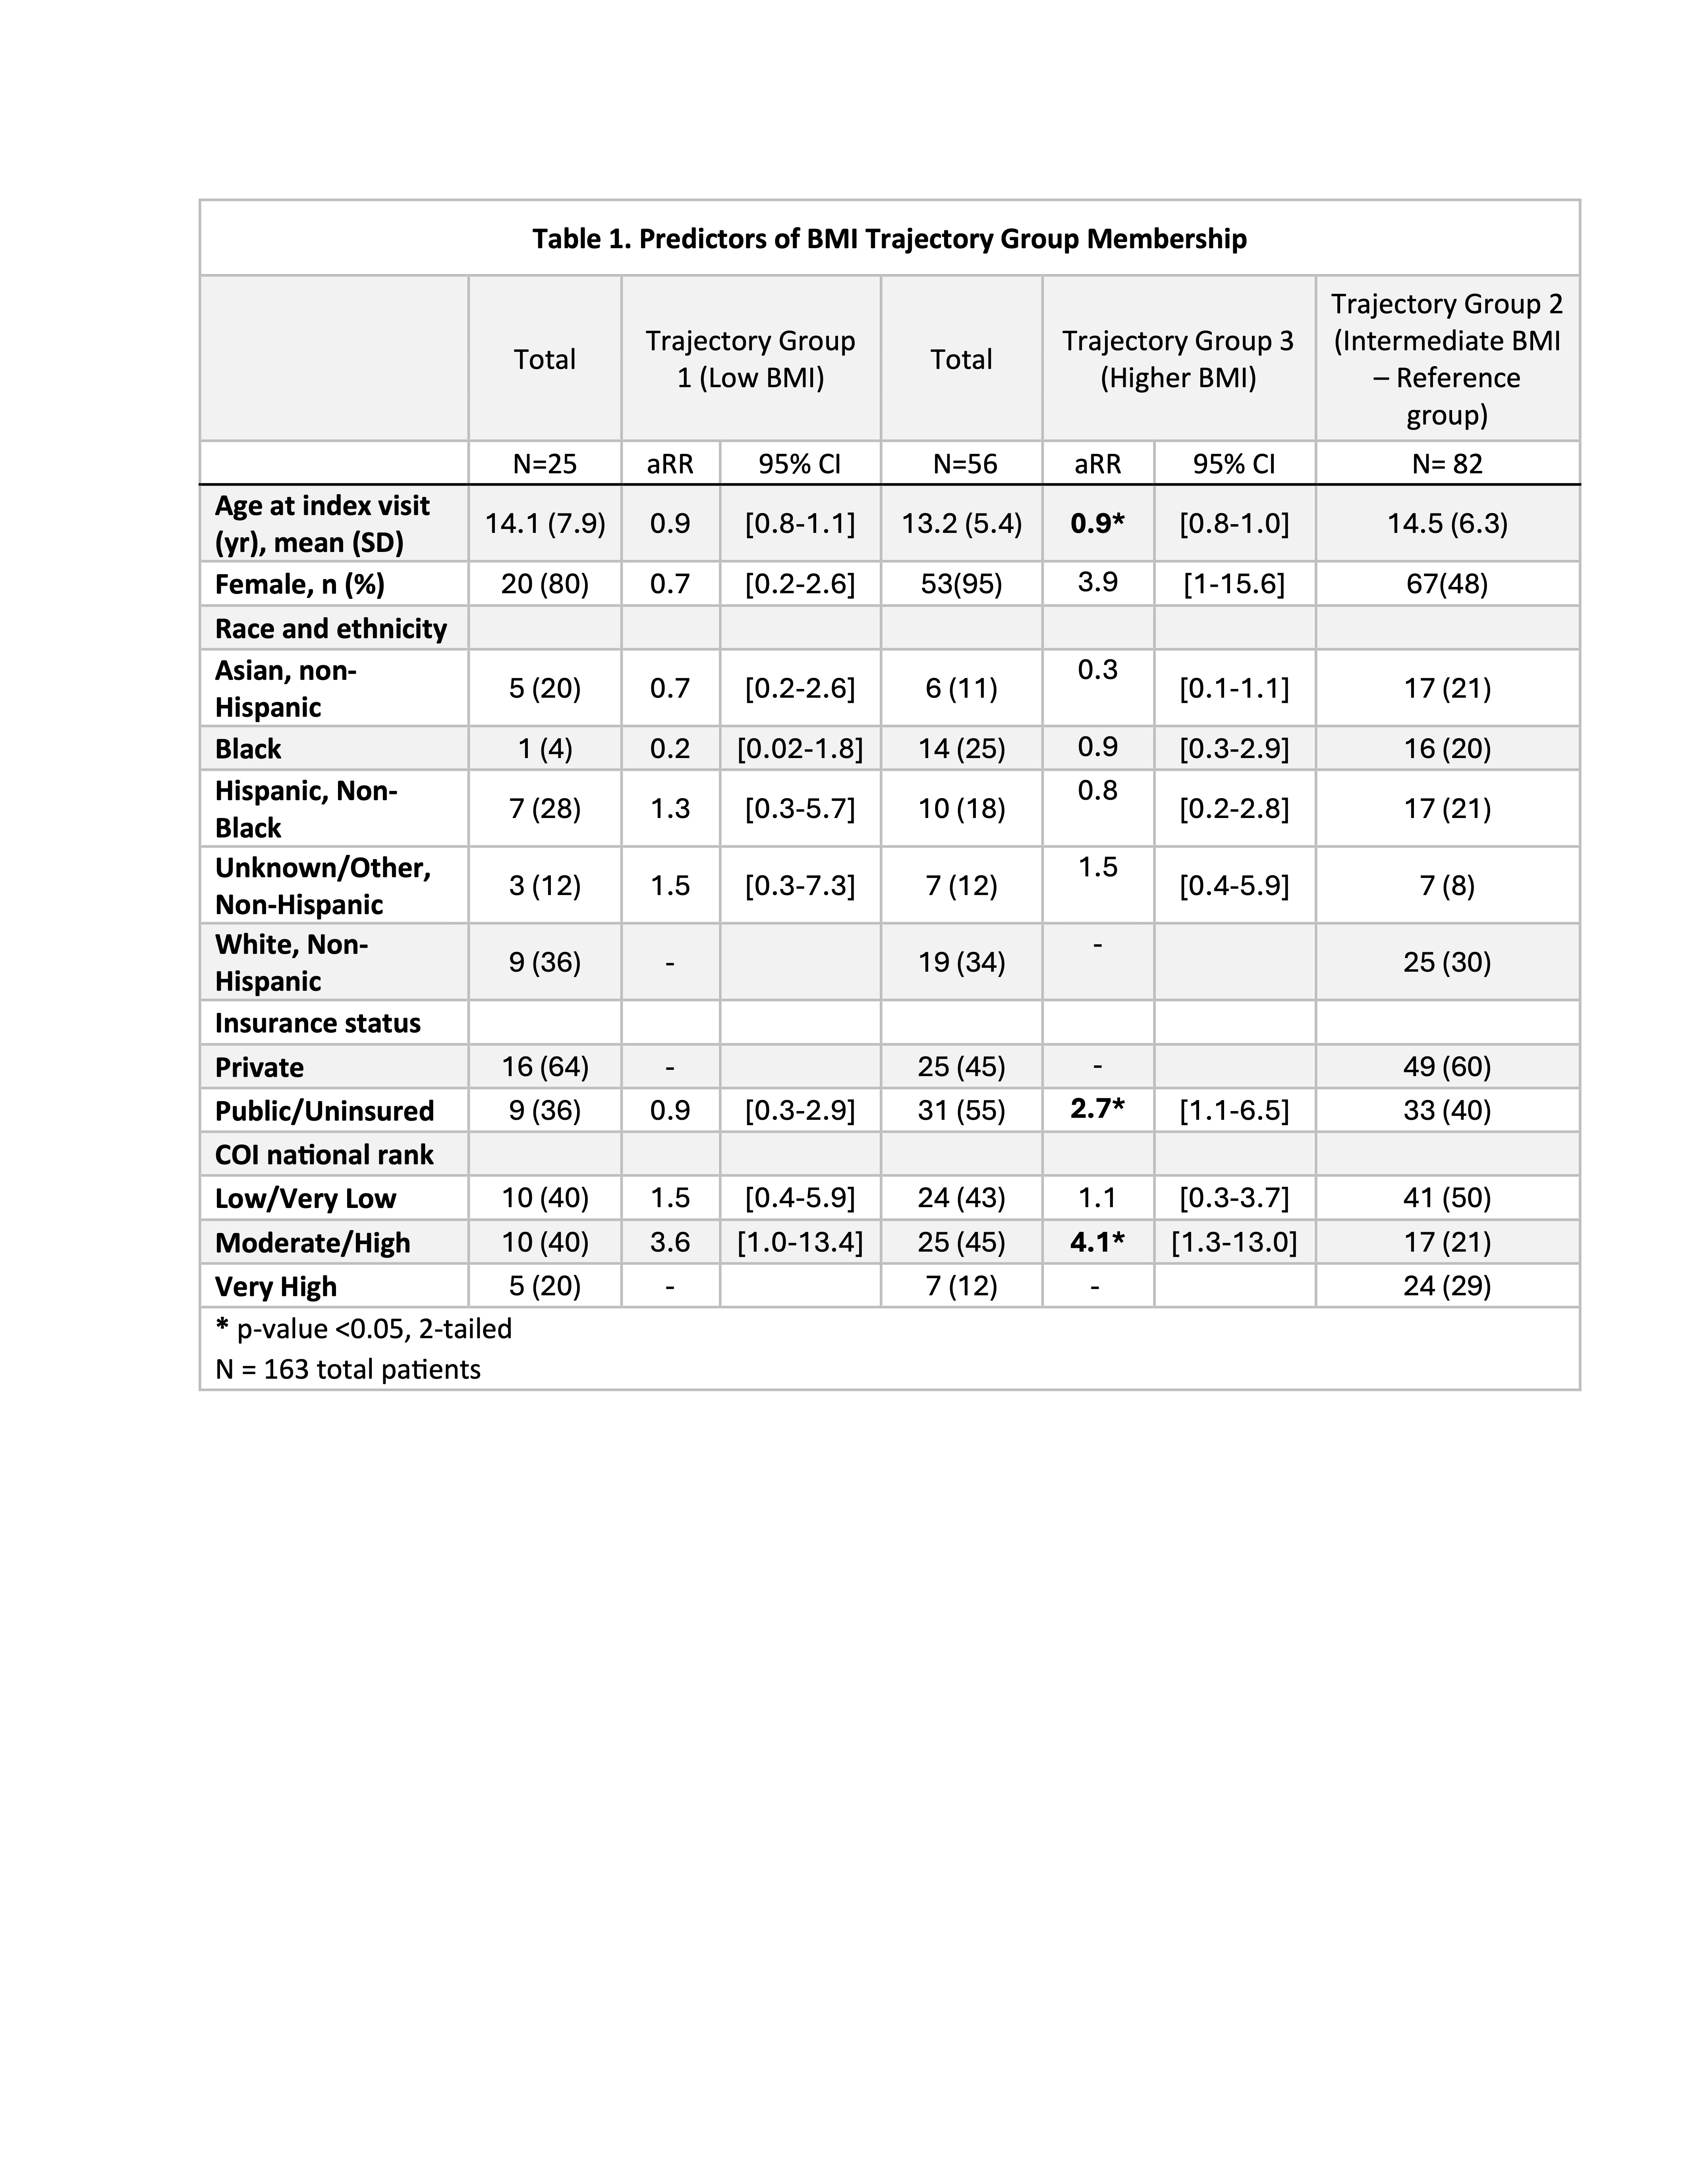 Multinomial logistic regression estimates of relative risk ratios (RRR) representing the likelihood of belonging to either the “Low” or “High” BMI trajectory group compared with the reference group (“Intermediate” BMI). Models include baseline COI level, age, sex, racial ethnic category, and insurance. Language preference, baseline prednisone dose, and baseline SLEDAI-2K were tested in the models and did not meet criteria for retention (p-value < 0.2 or evidence of confounding as determined by a change in coefficients of interest by at least 15%).
Figure 1. BMI trajectories in Pediatric Lupus patients. 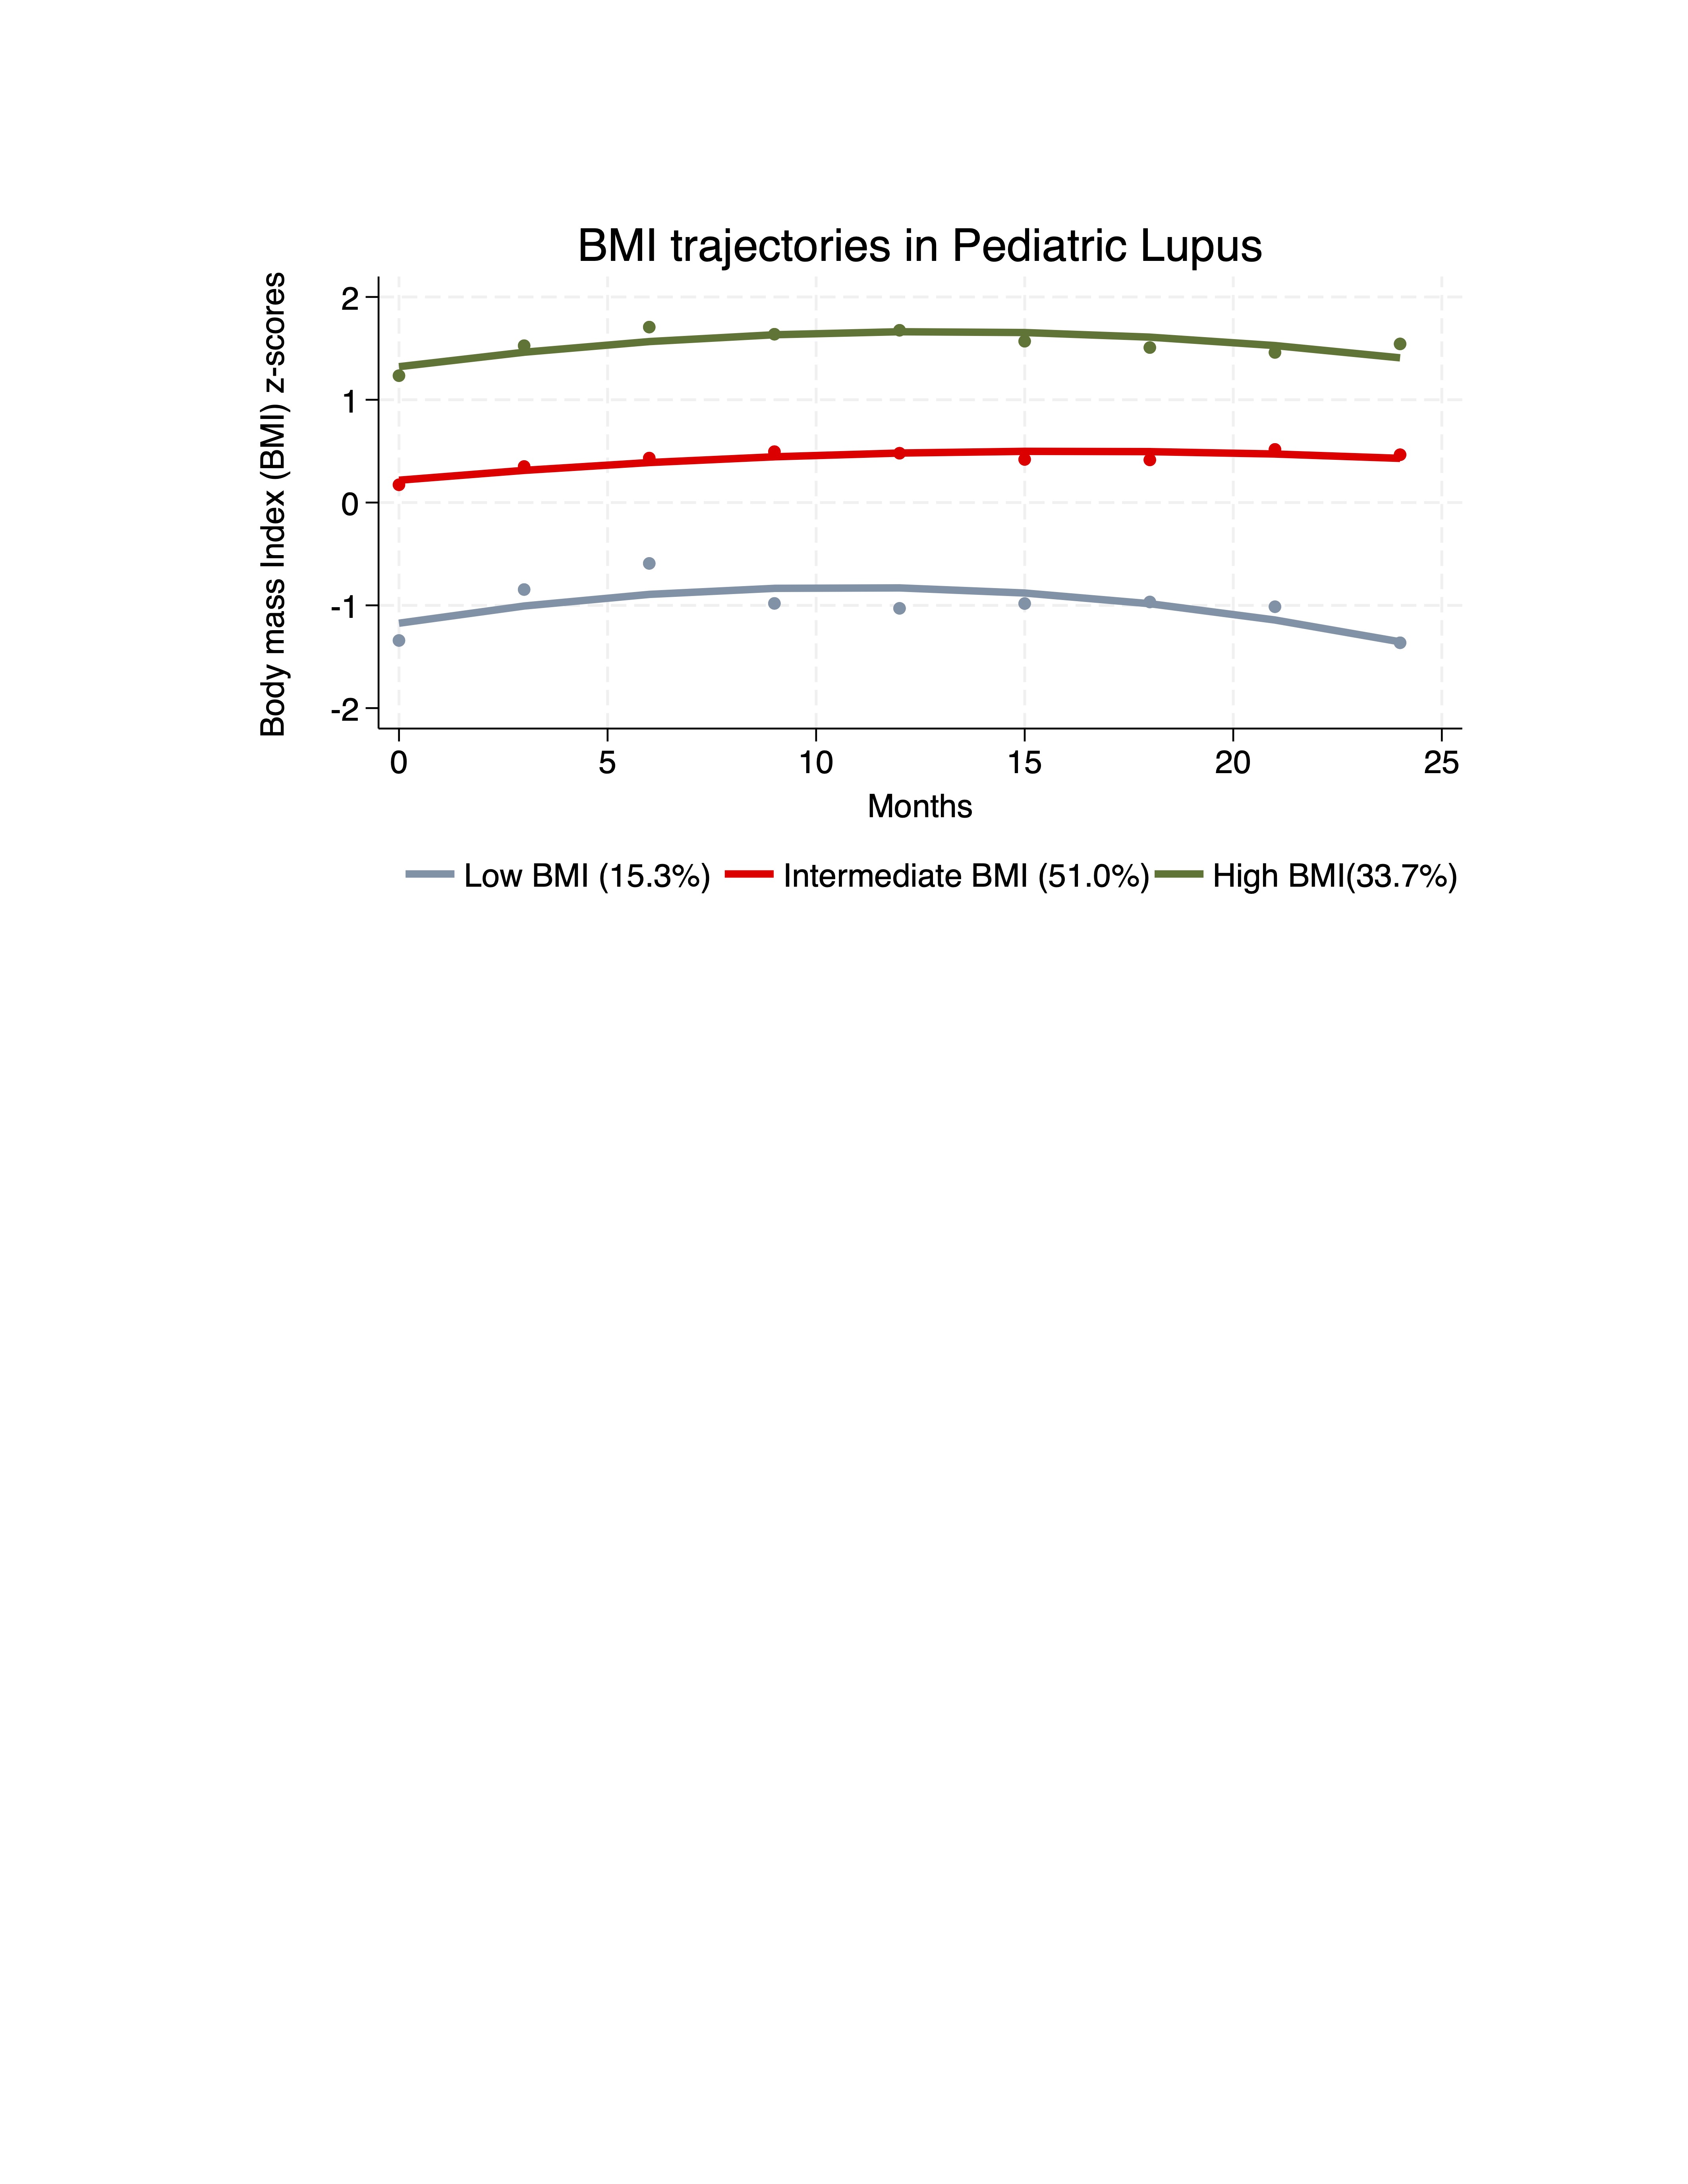 Longitudinal BMI trajectories (BMI z-score for age and sex) among individuals with cSLE (n=163) derived using group-based trajectory modeling. Three groups were identified: low BMI (consistently lower BMI across visits), normal BMI (intermediate BMI), and high BMI (consistently higher BMI).
Figure 2. Predicted disease activity and proteinuria by COI and BMI category.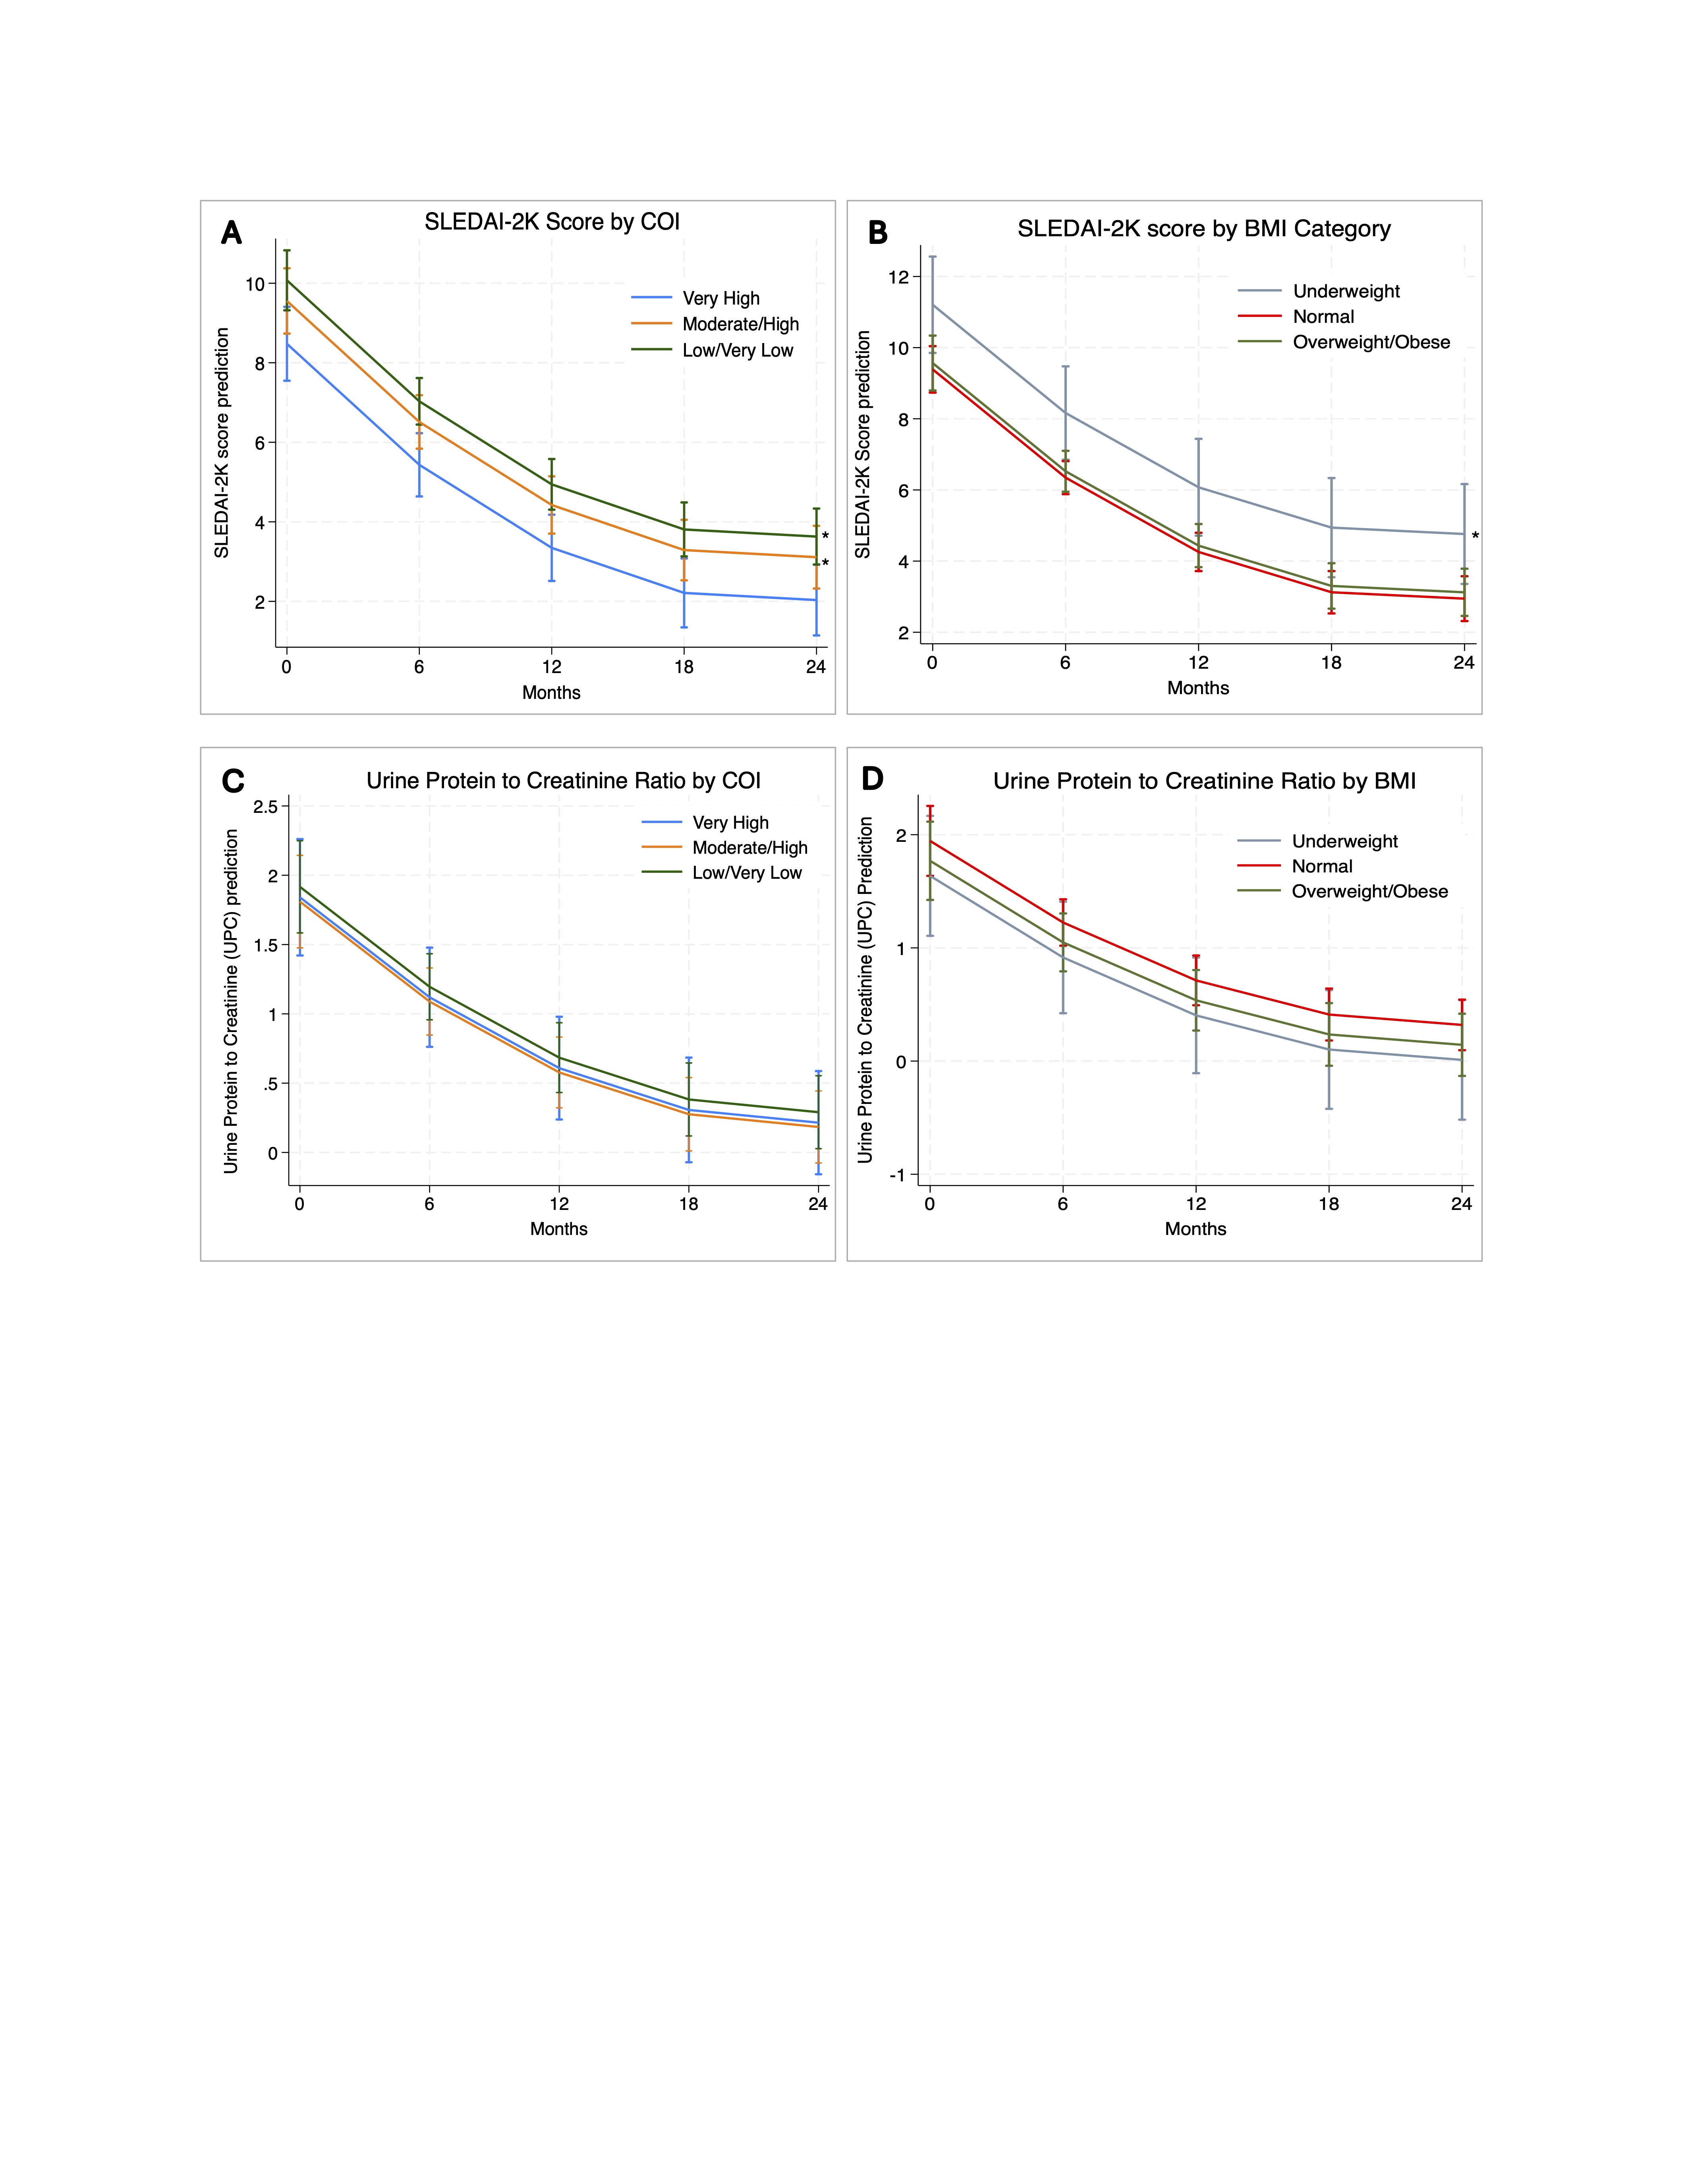 A. Model-predicted SLEDAI-2K scores over time stratified by COI group, adjusted for age, sex, insurance, race and BMI. B. Model-predicted SLEDAI-2K scores over time stratified by BMI category, adjusted for age, sex, insurance, race and COI. C. Model-predicted urine protein-to-creatinine ratio (UPC) scores over time by COI group. D. Model-predicted urine protein-to-creatinine ratio (UPC) scores over time by BMI category, adjusted for age, sex, insurance, race and BMI. Predictions are derived from mixed-effects linear regression models with random intercept and random slope accounting for repeated measures within patients. Lines represent model-estimated marginal means; capped spikes indicate 95% confidence intervals. Asterisk represents statistically significant results (p-value < 0.05, 2-tailed).
To cite this abstract in AMA style:
Gordon De Jesús A, Daga A, Chang J. Body Mass Index, Neighborhood Opportunity, and Outcomes of Childhood-Onset Lupus [abstract]. Arthritis Rheumatol. 2026; 78 (suppl 3). https://acrabstracts.org/abstract/body-mass-index-neighborhood-opportunity-and-outcomes-of-childhood-onset-lupus/. Accessed .« Back to 2026 Pediatric Rheumatology Symposium
ACR Meeting Abstracts - https://acrabstracts.org/abstract/body-mass-index-neighborhood-opportunity-and-outcomes-of-childhood-onset-lupus/