Session Information
Session Type: Abstract Submissions (ACR)
Background/Purpose: An essential element of treat to target strategy is adjusting therapy in the absence of achieving a target response by 12 wk. A DDAS28 of 1.2 and Simplified Disease Activity Index of 50% (SDAI50) are used as response measures (RM). Our objective was to assess the relationship between the 2 RM and to characterize patients failing to respond based on either RM.
Methods: Data from the Canadian early ArThritis CoHort (CATCH), an early arthritis cohort of patients with symptoms duration of ≤ 12 mo were used. Among patients with RA, we assessed biologic naive patients with available data to calculate DAS28 and SDAI at baseline (BSL) and 12 wk. We included patients on stable DMARD (no D in therapy) during the first 3 mo of f/u. Response to treatment was evaluated at 12 wk.
Correlation and agreement between 2 criteria was assessed by kappa statistics and Spearman correlation. BSL characteristics and median change from BSL were compared in patients with discordant RM. Probability plots of achieving each RM against BSL DAS28 score were evaluated.
Results: In total, 419 patients were included. Most were women (75%) with mean age of 52.6 years. Other BSL variables (mean): disease duration 5.7 months, tender joint count (TJC) 9.0, swollen joint count (SJC) 8.2, DAS28 5.2, SDAI 29.7 and CRP 14.4.
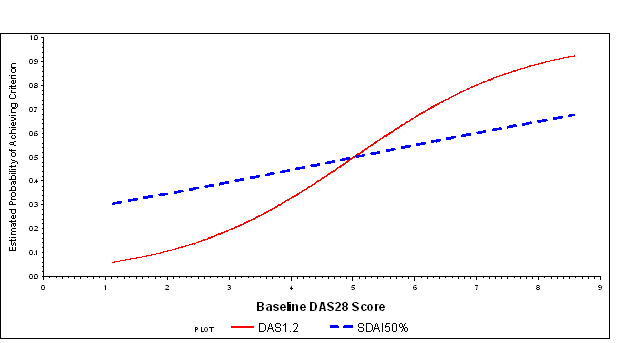
198 (47%) patients failed to achieve a DAS28D and 206 (49%) failed to achieve SDAI50. There was a significant agreement between DAS28 and SDAI50 RM (Kappa 0.66) with a Spearman Correlation of 0.66 (p<0001). Of patients failing SDAI50, 19.2% achieved a DAS28D, of patients failing a DAS28D, 16.6% patients achieved SDAI50. In patients with discordant RM, BSL disease activity measures were higher in DAS28 responders (Table). The probability of achieving the DAS28Dwas higher patients in higher disease activity and it was the opposite in the lower activity range (Figure). Median change of activity measures was higher in patient who achieved DAS28D (Table).
Conclusion: SDAI50 and DAS28 RM are well correlated although in patients in high disease activity states the likelihood of achieving an SDAI50 is lower than achieving a DAS28D, while the reverse is true at lower disease activity states.
 Figure: Plot of the predicted probability of achieving criterion DAS1.2 and SDAI50 against baseline DAS28 score.
Table: Comparing baseline characteristics and change in individual disease activity measures from baseline to 3 months in two patients with discordant RM
|
Baseline variables
|
Baseline characteristics
|
Median D in individual activity measures
|
||||
|
SDAI50-No DAS1.2-Yes N=40
|
SDAI50-Yes DAS1.2-No N=32
|
p-value
|
SDAI50-No DAS1.2-Yes N=40
|
SDAI50-Yes DAS1.2-No N=32
|
p-value
|
|
|
Age (years)* |
54.2 ±13.4 |
52.7 ±16.6 |
0.507 |
– |
– |
– |
|
Female n (%) |
29 (73) |
27 (71) |
0.266 |
– |
– |
– |
|
SJC28* |
10.3 ± 5.9 |
4.7 ± 5.26 |
<.0001 |
-3.0 |
-2.0 |
0.227 |
|
TJC28* |
12.7 ± 7.0 |
4.5 ± 5.5 |
<.0001 |
-4.0 |
-2.0 |
0.012 |
|
PHGA* |
59.5 ±23.3 |
38.9 ±26.6 |
0.002 |
-20.0 |
-30.0 |
0.083 |
|
HAQ * |
1.2 ± 0.6 |
0.9 ± 0.7 |
0.061 |
-0.44 |
-0.44 |
1.000 |
|
PTGA* |
72.6 ±25.8 |
36.8 ±27.1 |
<.0001 |
-40.0 |
-10.0 |
0.005 |
|
Pain* |
70.7 ±23.6 |
45.0 ±29.5 |
<.0001 |
-40.0 |
-17.5 |
0.005 |
|
CRP* |
23.9 ±20.9 |
9.3 ±14.5 |
<.0001 |
-8.3 |
-0.3 |
<0.0001 |
|
DAS28* |
6.1 ± 1.1 |
3.8 ± 1.0 |
<.0001 |
-1.7 |
-0.9 |
<0.0001 |
|
SDAI* |
38.7 ±14.8 |
17.6 ±12.2 |
<.0001 |
-13.8 |
-10.7 |
0.158 |
*mean (sd)
Disclosure:
M. Omair,
None;
E. C. Keystone,
None;
J. Xiong,
None;
G. Boire,
None;
J. E. Pope,
None;
J. C. Thorne,
None;
C. A. Hitchon,
None;
B. Haraoui,
None;
D. Tin,
None;
D. Weber,
None;
V. P. Bykerk,
None;
P. Akhavan,
None.
« Back to 2013 ACR/ARHP Annual Meeting
ACR Meeting Abstracts - https://acrabstracts.org/abstract/are-sdai50-and-das28-response-measures-comparable-in-early-rheumatoid-arthritis-patients/
