Session Information
Session Type: Plenary Session III
Session Time: 11:00AM-12:30PM
Background/Purpose: Billions of public dollars are spent each year on biologic disease-modifying anti-rheumatic drugs (bDMARDs), but the drivers of bDMARD spending and per-patient cost increases are unclear. We characterized changes in total spending and unit-prices for bDMARDs in Medicare and Medicaid and quantified the major sources of spending increases for public programs and beneficiaries.
Methods: Data Source and Measures: We accessed Medicare Parts B & D and Medicaid drug spending data for years 2012-2016. These contained aggregated prescription claims for all beneficiaries enrolled in Medicare Parts B (fee-for-service) or Part D (stand-alone or Medicare Advantage plans) or Medicaid. All bDMARDs with FDA approval for ≥ 1 rheumatic disease through Dec. 2014 were included. For each bDMARD and calendar-year we extracted total annual spending, and number of recipients, claims, and doses dispensed, and calculated drug unit-price (average cost/dose).
Statistical Analysis: We calculated five-year changes in total spending and unit-prices for each bDMARD and in-aggregate, after adjusting for general inflation to 2016 dollars. We then performed standard decomposition analyses to isolate the contributions of four sources of spending growth (drug prices, uptake [number of recipients], treatment intensity [mean # of doses per-claim], and annual # of claims per-recipient) for each bDMARD. We conducted our analysis including statutory Medicaid rebates (as these decrease public spending), and both excluding and including Medicare rebates (as these are paid by manufacturers to Pharmacy Benefit Managers and Part D plans). We used time-varying rebates reported by the Congressional Budget Office.
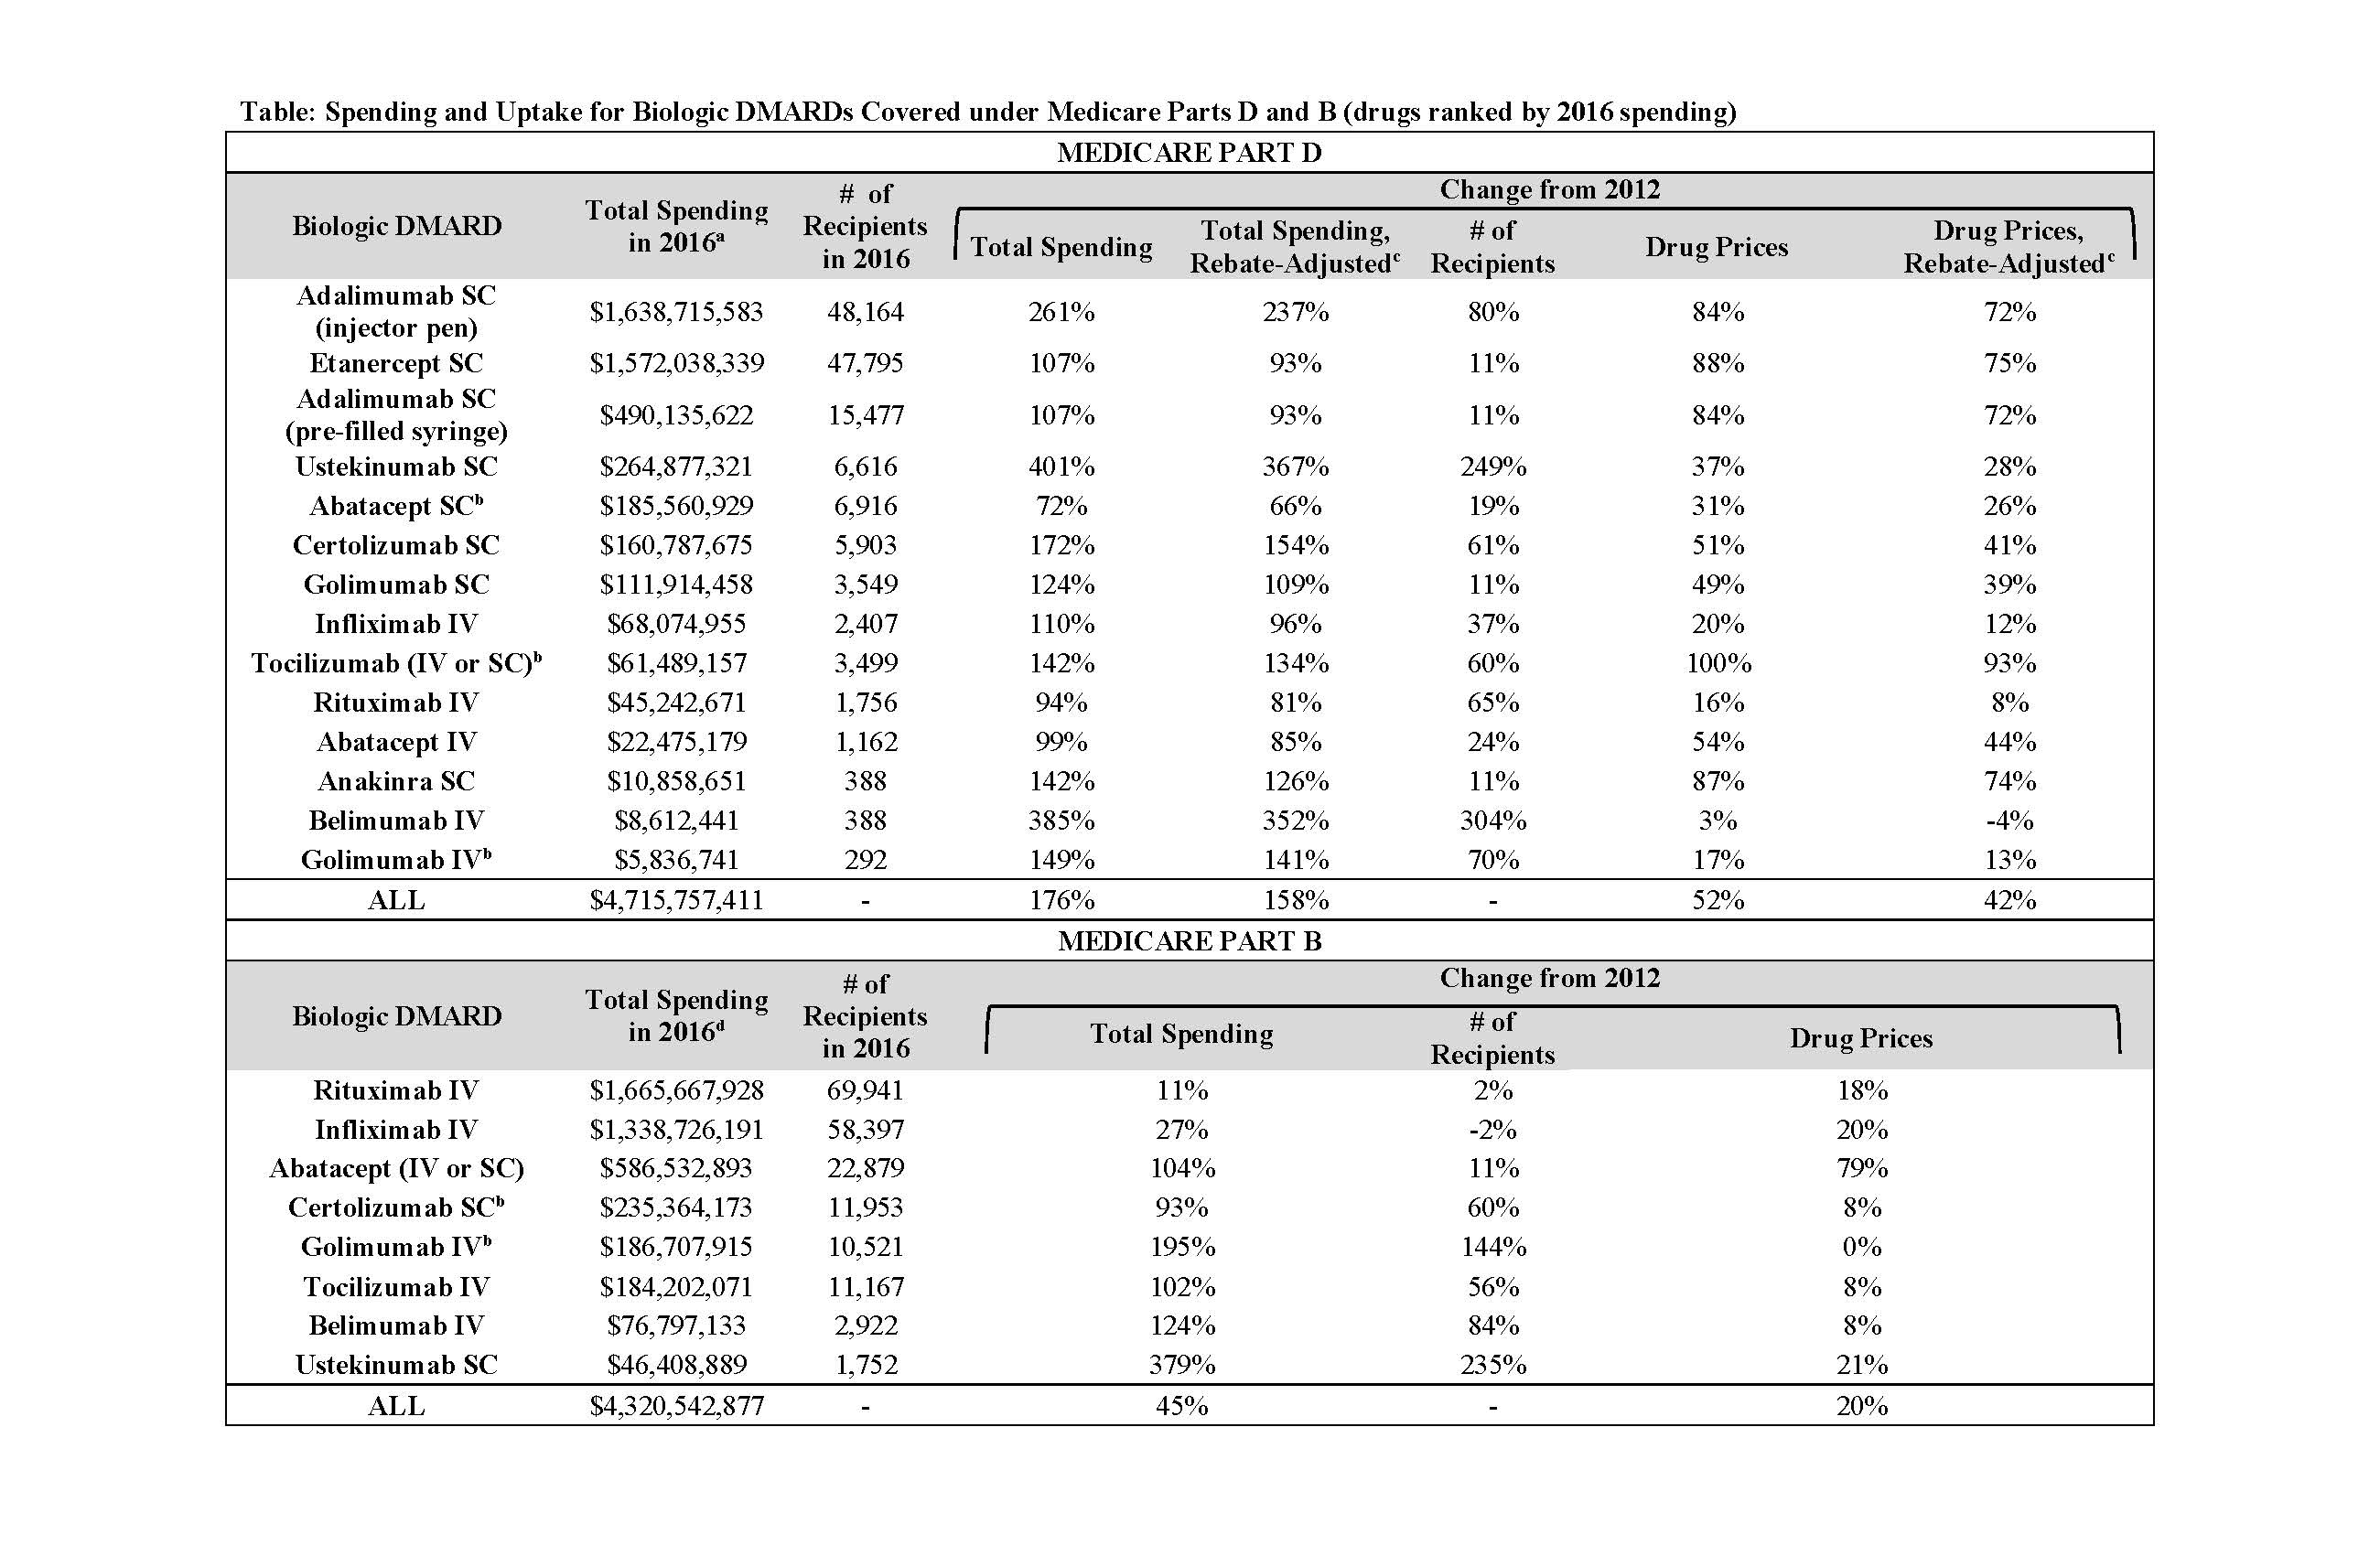
Results: From 2012-2016, annual spending on the 11 included bDMARDs by US public programs and beneficiaries nearly doubled (from $5.3 to $10.3 billion); drug prices increased by a mean of 52% in Part D and just 20% in Part B (Table). Controlling for general inflation, unit-price increases alone accounted for 56% ($1.7 billion) of the five-year, $3.0 billion spending increase within Part D (Figure); increased uptake accounted for 37% ($1.1 billion). After accounting for time-varying rebates, price hikes were still responsible for 53% ($1.4 billion) of the Part D spending increase. Adalimumab and etanercept, two of the oldest bDMARDs, were prescribed to the largest numbers of Part D beneficiaries and had the biggest unit-price increases: 84% and 88%, respectively. Medicaid spending and price trends were similar to Part D (Figure).
Majority of spending growth for the oldest Part B drugs (rituximab, abatacept, and infliximab) was from price increases (72-88%), while for the five newer drugs (golimumab, ustekinumab, tocilizumab, certolizumab, and belimumab), number of recipients was the main driver (63-81% of spending growth).
Conclusion: Post-market drug-price changes alone accounted for the majority of recent bDMARD spending growth, and manufacturers’ rebates had little impact on these findings. Beyond rebates, policy interventions that target price increases, particularly under Part D plans, may help mitigate public-payer drug spending and out-of-pocket costs for the elderly and disabled beneficiaries who rely on bDMARDs.

acr2019 bdmard cost abstract table
To cite this abstract in AMA style:
McCormick N, Wallace Z, Sacks C, Hsu J, Choi H. Decomposition Analysis of Spending and Price Trends for Biologic Anti-Rheumatic Drugs in Medicare and Medicaid [abstract]. Arthritis Rheumatol. 2019; 71 (suppl 10). https://acrabstracts.org/abstract/decomposition-analysis-of-spending-and-price-trends-for-biologic-anti-rheumatic-drugs-in-medicare-and-medicaid/. Accessed .« Back to 2019 ACR/ARP Annual Meeting
ACR Meeting Abstracts - https://acrabstracts.org/abstract/decomposition-analysis-of-spending-and-price-trends-for-biologic-anti-rheumatic-drugs-in-medicare-and-medicaid/

