Session Information
Session Type: ACR Poster Session C
Session Time: 9:00AM-11:00AM
Background/Purpose: Neurosarcoidosis is one of the great mimickers of primary angiitis of central nervous system (PACNS) in terms of disease presentation, imaging and pathologic findings. However treatment strategies are different specifically in term of biologics which is rarely used in PACNS. Therefore, distinguishing these diseases earlier would be important giving the distinct therapeutic implications. We aimed in this original study to distinguish demographic, cerebrospinal fluid (CSF) and laboratory characteristics of both diseases to enhance our diagnostic approach.
Methods: 79 patients with PACNS and 51 patients with neurosarcoidosis were included in the study. All the clinical, CSF and laboratory characteristics at the time of presentation were retrieved from electronic medical records. For comparisons on the basis of diagnosis, numerical variables were compared between groups using either ANOVA or the Kruskal-Wallis rank-sum test. Categorical variables were compared between groups using either Pearson’s chi-squared test or Fisher’s exact test. All analyses were performed using SAS 9.4 software (SAS Institute, Cary, NC). All testing was two-sided, and considered significant at the 5% level.
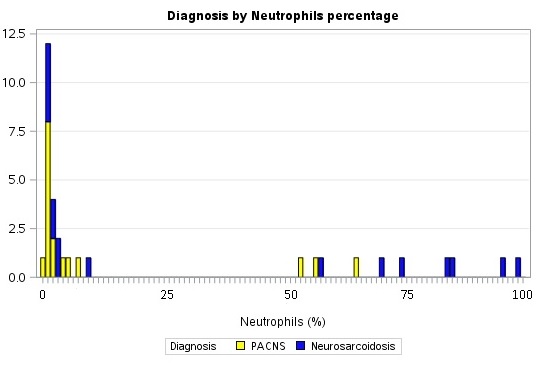
Results: Demographic and CSF characteristics, blood CRP, ESR, ANA, RF levels of the patients were shown in the Table. There was a statistically significant difference between diagnoses on two variables. The first was race, where African American patients tended to be diagnosed with neurosarcoidosis and Caucasian patients tended to be diagnosed with PACNS (p < 0.001). The second was ANA, where higher levels tended to be associated with neurosarcoidosis (p = 0.047), and lower levels tented to be associated with PACNS. Although not statistically significant, two other variables showed promise for distinguishing the two diagnoses: total nucleated cells (p = 0.067) and neutrophils (p = 0.14). Higher values of total nucleated cells showed some tendency toward neurosarcoidosis, whereas low values showed some tendency toward PACNS. Neutrophil counts in the high range tended to correspond to neurosarcoidosis, whereas neutrophil counts in the low range tended to correspond to PACNS (Figure).
Conclusion: African American race and positive ANA were found to be associated with the diagnosis of neurosarcoidosis rather than PACNS. Total nucleated cells and neutrophil counts in the CSF showed promise in differentiating the neurosarcoidosis and PACNS. A follow-up study with a larger sample size would be required to firmly establish such a relationship. Table. Demographic and CSF characteristics of patients with neurosarcoidosis and PACNS
| Total (N=130) | PACNS (N=79) | Neurosarcoidosis (N=51) | p-value | |
| Age at presentation* | 43.8±15.0 | 43.7±16.7 | 44.0±12.0 | 0.92 |
| Gender* | 0.40 | |||
| . Male | 70(54.3) | 40(51.3) | 30(58.8) | |
| . Female | 59(45.7) | 38(48.7) | 21(41.2) | |
| Race* | <0.001 | |||
| . Caucasian | 110(88.0) | 73(97.3) | 37(74.0) | |
| . African American | 15(12.0) | 2(2.67) | 13(26.0) | |
| CSF Glucose* | 65.0±27.1 | 66.6±21.4 | 62.7±34.3 | 0.59 |
| CSF Protein* | 60.0[37.5,90.5] | 59.0[37.0,73.0] | 61.0[38.0,133.0] | 0.25 |
| CSF Reac Lymph%* | 2.0±1.6 | 2.0±1.7 | 2.1±1.6 | 0.88 |
| CSF RBC* | 5.0[1.00,46.5] | 6.5[0.00,32.0] | 3.0[1.00,235.0] | 0.47 |
| CSF Neutrophils* | 0.14 | |||
| . Neutrophils < 40% | 23(69.7) | 14(82.4) | 9(56.3) | |
| . Neutrophils ≥ 40% | 10(30.3) | 3(17.6) | 7(43.8) | |
| CSF Lymph%* | 86.5[57.0,92.5] | 85.5[60.0,93.0] | 87.0[41.0,91.0] | 0.51 |
| CSF Mono%* | 7.0[4.0,16.0] | 8.0[4.0,16.0] | 7.0[4.0,11.0] | 0.65 |
| CSF Total nucleated cells* | 12.0[2.0,36.0] | 8.5[1.00,32.0] | 17.0[6.0,50.0] | 0.067 |
| ACE/Angiotensin Blood* | 28.6±20.2 | 25.1±19.7 | 29.9±20.5 | 0.44 |
| Blood Soluble IL2-R levels* | 641.0[425.0,1000.0] | 600.5[397.0,722.0] | 647.0[458.0,1000.0] | 0.84 |
| CRP* | 0.60[0.20,3.7] | 0.70[0.20,4.9] | 0.55[0.15,1.00] | 0.41 |
| ESR* | 12.5[5.0,28.0] | 15.0[5.0,29.0] | 8.0[7.0,24.0] | 0.61 |
| ANA* | 0.30[0.20,0.70] | 0.30[0.20,0.50] | 0.50[0.30,0.80] | 0.047 |
| RF* | 7.0[5.0,9.0] | 7.0[2.5,9.0] | 8.0[7.0,10.0] | 0.31 |
| *Data not available for all subjects. Missing values: ACE/Angiotensin Blood = 74, Age at presentation = 3, Glucose = 68, Reac Lymph% = 108, Blood Soluble IL2-R levels = 83, Lymph% = 66, Mono% = 67, Total nucleated cells = 66, Protein = 66, RBC = 66, Gender = 1, Neutrophils = 97. Additionally, 2 Asian, 1 Arabic, and 2 non-identifying patients are not included the analysis. Values presented as Mean ± SD, Median [P25, P75], or N (column %). | ||||
Figure. Neutrophil Counts in Cerebrospinal fluid and its association with the type of diagnosis. 
To cite this abstract in AMA style:
Saygin D, Calabrese LH, Ray E, Messner W, Tavee J, Hajj-Ali RA. Differentiation Between Neurosarcoidosis and Primary CNS Vasculitis Based on Clinical and Cerebrospinal Fluid Parameters [abstract]. Arthritis Rheumatol. 2016; 68 (suppl 10). https://acrabstracts.org/abstract/differentiation-between-neurosarcoidosis-and-primary-cns-vasculitis-based-on-clinical-and-cerebrospinal-fluid-parameters/. Accessed .« Back to 2016 ACR/ARHP Annual Meeting
ACR Meeting Abstracts - https://acrabstracts.org/abstract/differentiation-between-neurosarcoidosis-and-primary-cns-vasculitis-based-on-clinical-and-cerebrospinal-fluid-parameters/
